simple MACD trading strategy | R:R = 1:3❤️🔥+ Backtest
Tools Required for the MACD Trading Strategy
One of the most appealing aspects of the MACD trading strategy is its simplicity—you don’t need a complex array of tools or indicators to execute it effectively. All you need is the MACD (Moving Average Convergence Divergence) indicator, which can be easily added to your chart on any trading platform. To enhance clarity and precision, switch your chart display to candlestick mode, which allows you to see the price action more clearly. This straightforward setup is what makes the MACD strategy so accessible and widely popular among traders. No need to clutter your screen with countless indicators—just focus on the power of the MACD, and you’re ready to trade.
Best Settings for the MACD Indicator
When it comes to setting up the MACD for scalping or day trading, simplicity is key. The default settings of the MACD indicator—12, 26, 9—are perfectly suited for most trading scenarios. However, if you’re looking to add a bit more customization to your strategy, there are alternative versions of the MACD available. Some of these versions include features like notifications and alerts for changes in the MACD bars, which can help you monitor market movements more effectively. Whether you stick with the default or explore these enhanced versions, the MACD remains an incredibly versatile tool for any trading strategy.

Ideal Timeframes for the MACD Trading Strategy
The beauty of the MACD trading strategy lies in its flexibility—it works effectively across all timeframes. However, since this strategy is particularly designed for scalping, it truly shines in lower timeframes where quick decisions are key. For those looking to maximize the strategy’s potential, we recommend using 1-minute, 5-minute, 15-minute, or 30-minute timeframes. These shorter intervals allow you to capitalize on rapid market movements and make the most out of each trade. That said, if your schedule doesn’t allow for constant monitoring, you can still successfully apply this strategy on higher timeframes like the 4-hour or daily charts. Whether you’re aiming for quick profits or a more relaxed trading pace, the MACD indicator adapts effortlessly to your needs.
How the MACD Trading Strategy Works
Now that we’ve covered the fundamentals, it’s time to dive into the specifics of how the MACD trading strategy operates. This strategy’s simplicity is its strength, allowing traders to capitalize on market movements with minimal confusion. Below, we’ll outline two basic setups—one for buying and one for selling—along with guidance on setting your take profit and stop loss levels.
Buy Setup:
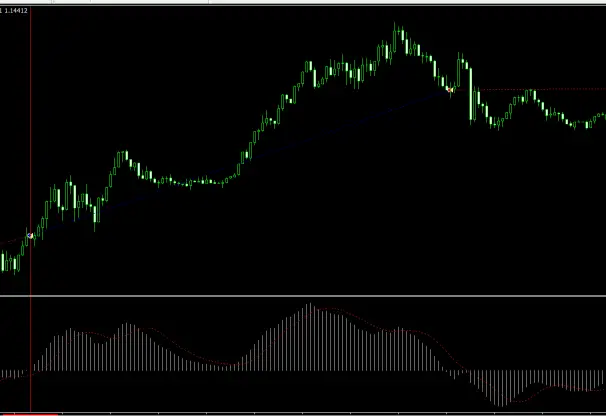
When the MACD histogram bars transition from a bearish phase (below the zero line) to a bullish phase (above the zero line), it signals a potential buy opportunity. However, patience is key—wait for the first bullish bar to fully form before entering a buy position on the second bar. This cautious approach helps you avoid the risk of entering too early, as the histogram bar’s position can change with market fluctuations.
Sell Setup:
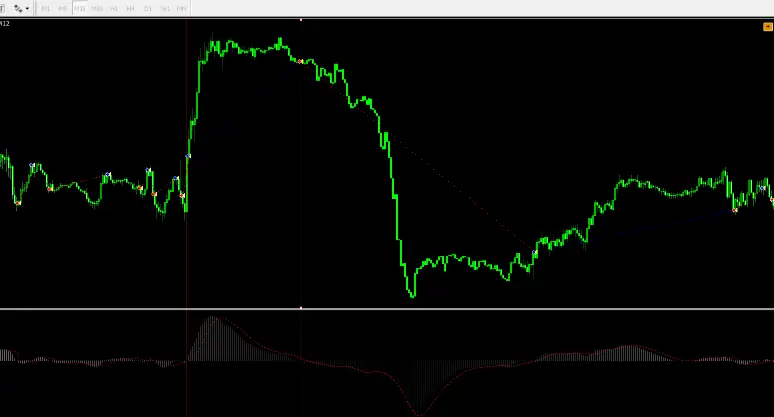
Conversely, a sell signal occurs when the MACD histogram bars shift from a bullish phase to a bearish one. Again, it’s crucial to wait for the first bearish bar to complete before entering a sell trade on the second bar. This strategy helps you align with the momentum of the market, reducing the likelihood of getting caught in a false signal.
Take Profit:
Your take profit level can be flexible and should align with your overall risk management plan. Many traders opt to exit when they notice candlestick weakness or when a 1:1 risk-reward ratio is achieved. However, a more advanced approach involves staying in the trade until the MACD histogram bars signal a phase shift in the opposite direction. This method allows you to potentially capture more significant market trends and maximize your profits.
Stop Loss:
Setting a stop loss is just as critical as determining your take profit. You can base your stop loss on candlestick weakness or a reversal in the MACD indicator. Alternatively, some traders prefer to set a fixed 1:1 risk-reward ratio. The key is to protect your capital while allowing enough room for the trade to develop.
This strategy, with its straightforward setups and clear signals, empowers traders to make informed decisions without getting bogged down in complexity. Whether you’re a beginner or an experienced trader, the MACD trading strategy offers a practical and effective way to navigate the markets.
Key Considerations for Trading with the MACD Strategy
As you’ve likely gathered by now, the MACD trading strategy is not only appealing for its simplicity but also for its effectiveness in capturing market trends. However, like any trading approach, there are crucial points you must keep in mind to maximize your success and minimize potential pitfalls. Let’s explore some of these essential considerations.
The first and perhaps most critical aspect to remember is patience. It’s tempting to jump into a trade as soon as you see the MACD histogram bars begin to shift. However, to improve accuracy, you should always wait for the first bar of the histogram to fully form before entering a trade on the second bar. This caution helps you avoid premature entries that might result from the histogram bars changing as the market fluctuates. By waiting for confirmation, you increase the likelihood that your trade aligns with the actual market momentum.
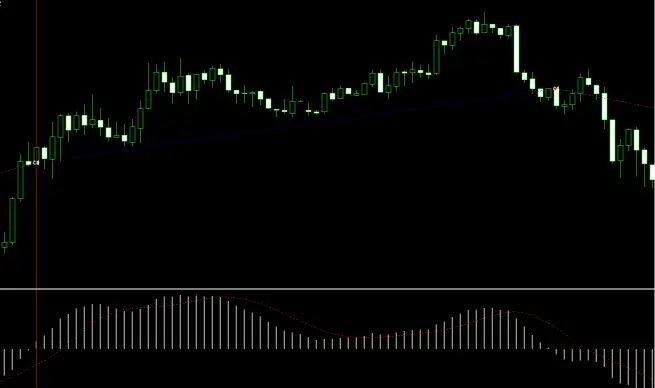
Another important point is avoiding distractions from other chart elements. The MACD strategy works best when your focus remains on the histogram bars rather than getting caught up in other potential setups or patterns that might appear on the chart. Overanalyzing or trying to combine too many indicators can lead to confusion and hesitation, ultimately undermining the simplicity and effectiveness of this strategy. Keep your analysis straightforward and centered on the MACD signals.
Sticking to the strategy is the third key to success. The MACD strategy, like many others, involves a series of small losses that are part of the process. It’s essential to understand that these minor losses are not a sign of failure but rather an integral part of reaching larger gains. Over time, the strategy tends to yield significant trends that can outweigh the small losses. From my experience and backtesting, the profits from successful trades often exceed losses by two to three times. Therefore, if you encounter a string of small losses, don’t be discouraged. Trust in the system and maintain discipline, as the larger winning trades are likely just around the corner.
In summary, while the MACD trading strategy is simple and powerful, its success relies heavily on your discipline and focus. By practicing patience, staying committed to the strategy, and avoiding unnecessary distractions, you can harness the full potential of the MACD to navigate the markets effectively. Remember, the real strength of this strategy lies in its ability to capture those substantial market moves that can significantly enhance your trading results.
Backtest Results for the MACD Trading Strategy
In the world of trading, a strategy’s true value is often revealed through rigorous backtesting. At PicoChart, our commitment to providing profitable and effective trading strategies drives us to thoroughly evaluate each one before sharing it with our community. Backtesting not only helps us understand a strategy’s potential but also allows us to present our findings transparently, so you can make informed decisions. With this in mind, we put the MACD trading strategy to the test, and the results are shared below.
For this backtest, we focused on the EUR/USD currency pair over a one-month period, from October 14, 2021, to November 14, 2021. The test was conducted on a 15-minute timeframe, a commonly used setting for day trading and scalping strategies. The results, illustrated in the accompanying images, provide valuable insights into the strategy’s performance under these specific conditions.
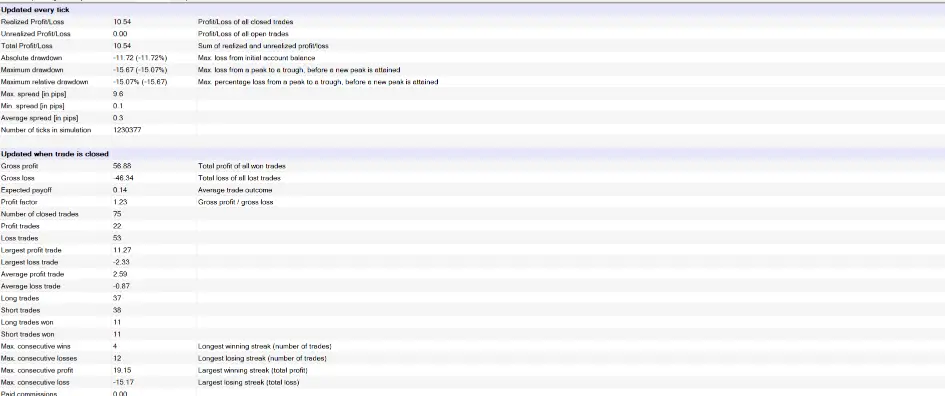
Over the course of this month, we executed 75 trades using the MACD strategy. Out of these, 22 trades were profitable, while 53 resulted in losses. At first glance, this might seem discouraging, but here’s where the MACD strategy’s strength shines through: despite the higher number of losing trades, the overall outcome was positive. The key lies in the ratio of profit to loss—our average winning trade yielded $2.59, while the average losing trade cost us only $0.87. This impressive 3:1 profit-to-loss ratio ultimately led to a net gain of 10% on our account, even with a modest trade size of 0.01 lots.
This backtest underscores a crucial point: success in trading doesn’t necessarily require a high win rate. Instead, it’s the ability to capitalize on larger wins while keeping losses small that drives profitability. The MACD strategy, as demonstrated in this test, excels at identifying those significant market moves that can make a real difference in your trading account over time.
However, it’s important to note that while our findings are promising, we do not endorse or reject any strategy outright. At PicoChart, we believe that every trader must find their own path, guided by personal experience and knowledge. We encourage you to conduct your own backtests and demo trading to determine if this strategy aligns with your trading style and goals. Remember, trading involves risks, and while we share our insights and tools, the responsibility for any profits or losses rests with you.
In summary, the backtest of the MACD trading strategy on the EUR/USD pair over a one-month period highlights its potential to deliver consistent returns, even in the face of frequent small losses. This strategy’s robust profit-to-loss ratio is its standout feature, proving that disciplined execution can lead to positive outcomes.


