best HeikenAshi and TDI Strategy | R:R=1:2 ⚡+ backtest
When it comes to navigating the vast world of Forex trading, simplicity often becomes the most powerful tool. The Heiken Ashi indicator is renowned for its ability to smooth out market noise, making long-term trends more visible and accessible. But, like any tool in trading, relying on it alone may not be enough to capture the full potential of the market. This is where the magic happens—when the Heiken Ashi strategy is paired with the TDI (Traders Dynamic Index) indicator, it creates a powerful combination that offers precision and clarity. This synergy transforms a good strategy into an exceptional one.
In this article, we’re going to introduce you to one of the simplest yet most effective strategies in the trading world, utilizing both the Heiken Ashi and TDI indicators. The beauty of this strategy lies in its versatility—you can apply it across all trading platforms, whether you’re focusing on the 1-minute or 5-minute charts. The Heiken Ashi scalping strategy, enhanced by the TDI indicator, provides a comprehensive approach to capturing market trends. If you’re keen to explore this unique trading strategy, stick with us until the end. We’ve also included the results of a backtest, offering you a clear view of its effectiveness and reliability.
Overview of the Trading Strategy with Heiken Ashi and TDI Indicators
Imagine a strategy that blends the strengths of two of the most reliable indicators in the trading world: the Heiken Ashi and the TDI (Traders Dynamic Index). The combination of these two indicators offers a powerful toolset for traders looking to enhance their market analysis. The Heiken Ashi indicator is renowned for its ability to smooth out market noise, making it easier to spot trends and potential reversal points. By averaging price data, this indicator helps traders to better identify the direction of the market, whether it’s in an uptrend or downtrend, without the distraction of minor price fluctuations. Meanwhile, the TDI indicator complements this by incorporating elements of the RSI, Moving Averages, and volatility bands, providing a comprehensive view of market momentum and potential entry or exit points.
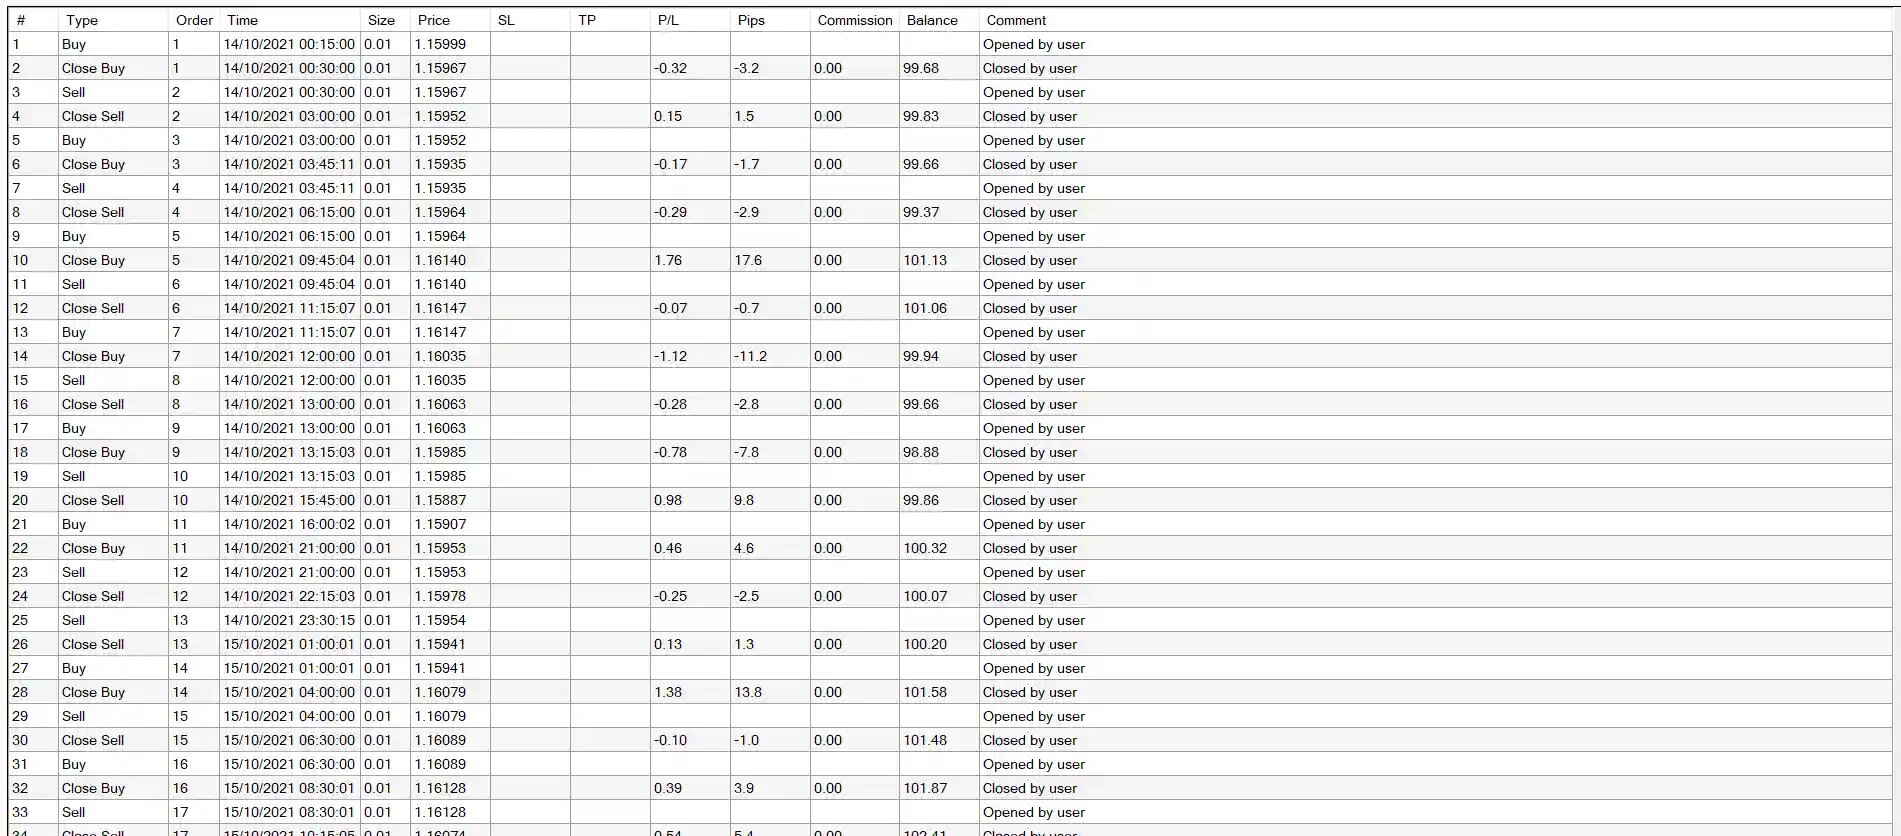
Together, these indicators create a robust framework for traders, especially those who are into scalping or trading lower time frames. The Heiken Ashi is particularly effective in highlighting the main trend, while the TDI helps to confirm the strength of that trend or signal potential reversals. This dual approach means that whether you’re using a Heiken Ashi 5 min strategy or looking for opportunities in higher time frames, you have a versatile toolset at your disposal. The strategy shines across different market conditions and is applicable to a variety of trading platforms, making it an attractive choice for traders of all experience levels.
What sets this strategy apart is its impressive success rate. On average, traders can expect a success rate of over 50%, making it a reliable method for consistent profits. Its adaptability across both high and low time frames means that it can be tailored to suit various trading styles, whether you’re a day trader, swing trader, or someone who prefers a longer-term approach. Given its versatility and proven effectiveness, the Heiken Ashi and TDI strategy is undoubtedly one of the best TDI forex strategies available, capable of delivering impressive results across different market scenarios.
Tools Required for the Heiken Ashi and TDI Trading Strategy
One of the most appealing aspects of the Heiken Ashi and TDI strategy is its simplicity. You don’t need a cluttered chart filled with complex indicators or expensive tools to make this strategy work. All you need are the Heiken Ashi and TDI indicators, which can be easily added to your trading platform with just a few clicks. This simplicity is what makes the strategy so accessible and popular among traders. We’ve included both of these indicators below for your convenience, so you can start using them right away. The beauty of this approach lies in its effectiveness without the need for any unnecessary complications—just pure, straightforward trading that delivers results.
Best Settings for Heiken Ashi and TDI Indicators
When it comes to scalping or day trading with the Heiken Ashi and TDI indicators, simplicity is key. There’s no need to dive into complex configurations; the default settings for both indicators are more than sufficient to get started. The Heiken Ashi indicator’s default settings will already smooth out price action, making trends easier to spot, while the TDI will provide clear signals for market momentum and potential reversals. Of course, if you’re an experienced trader looking to fine-tune your strategy, you can experiment with different versions of these indicators, but for most, the standard settings work perfectly. This straightforward approach not only saves time but also keeps your focus where it should be—on the market, not on endless adjustments.
Ideal Time Frames for Scalping with Heiken Ashi and TDI
The beauty of the Heiken Ashi and TDI indicator strategy lies in its versatility across different time frames. While this approach works well on any time frame, it truly shines in lower time frames, making it an ideal choice for scalpers. For those seeking quick trades and rapid market movements, we recommend using the 1-minute, 5-minute, 15-minute, and 30-minute charts. These time frames allow you to capitalize on short-term price fluctuations, maximizing the strategy’s effectiveness. However, if you’re short on time or prefer a more relaxed trading style, this strategy is also effective on higher time frames like the 4-hour or daily charts. This flexibility makes it a go-to strategy for traders of all styles, whether you’re looking for fast-paced action or steady, longer-term gains
How the HeikenAshi and TDI Trading Strategy Works
Now, let’s dive into how the Heiken Ashi and TDI trading strategy works. The setup is straightforward, making it accessible even for beginners. Below, we’ve outlined two simple methods for executing trades using this strategy.
Buy Trade:
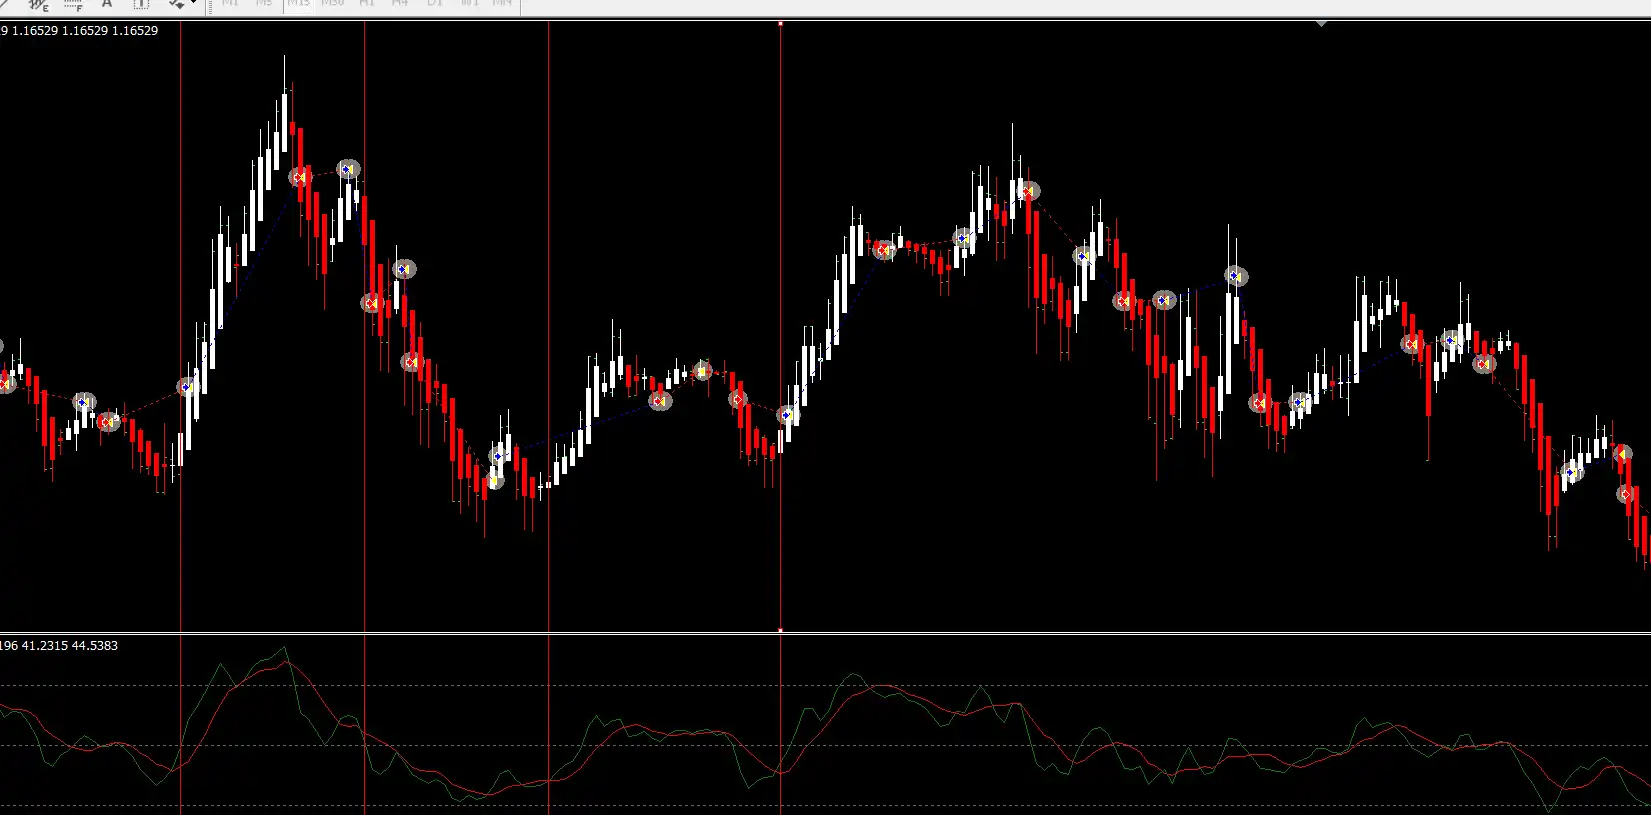
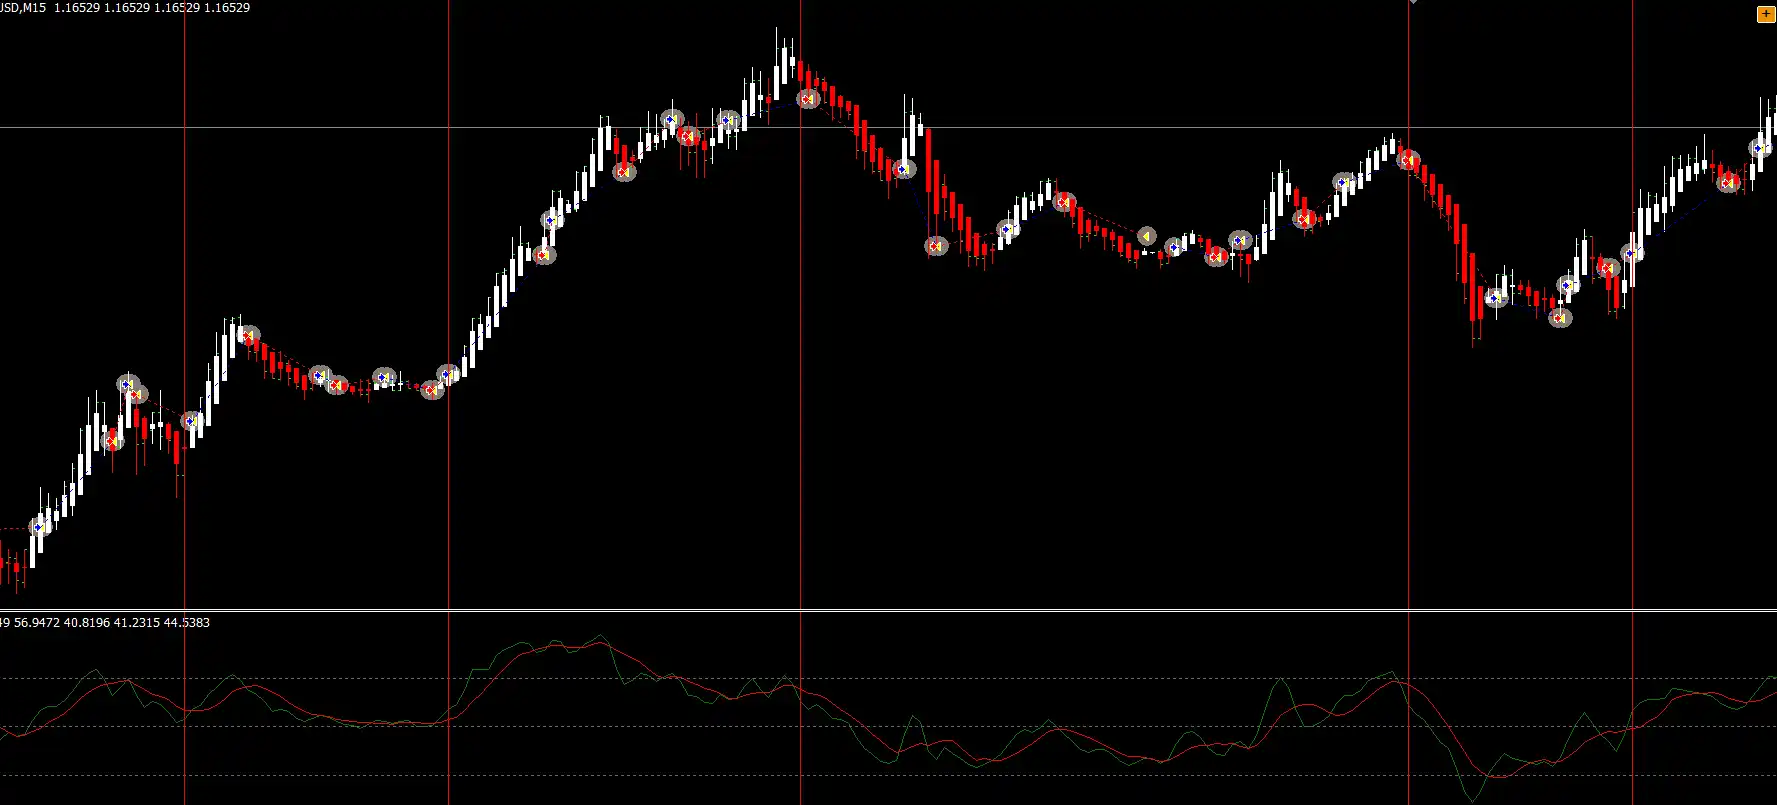
When you notice Heiken Ashi candles turning bullish (typically shown as green or white candles depending on your chart settings) and the TDI indicator shows the green line crossing above the red line, it’s a clear signal to enter a buy trade. This combination indicates upward momentum, and entering a buy position at this point aligns you with the prevailing trend.
Sell Trade:
Conversely, if the Heiken Ashi candles turn bearish and the green line on the TDI indicator crosses below the red line, it’s time to consider a sell trade. This setup signals a potential downtrend, and entering a sell position here allows you to capitalize on the falling market.
Take Profit:
The take profit in this strategy is largely dependent on your personal risk management and trading style. A common approach is to exit the trade when you see candle weakness, or when the price reaches a 1:1 risk-reward ratio. However, I personally prefer to hold onto the trade until the Heiken Ashi candles and the TDI chart give an opposite signal, allowing me to capture larger trends. This method ensures that you stay in the trade for as long as the trend remains strong, maximizing your potential profit.
Stop Loss:
For stop loss, you can use candle weakness or a reversal in the Heiken Ashi indicator as your cue to exit. Additionally, you might set your stop loss based on your own risk tolerance or simply use a 1:1 ratio. By carefully managing your stop loss, you can minimize potential losses while giving your trade enough room to breathe in the market.
Key Points to Consider with the Heiken Ashi and TDI Trading Strategy
The simplicity of the Heiken Ashi and TDI trading strategy is one of its most attractive features. Its straightforward structure makes it accessible to traders of all experience levels, allowing anyone to jump in and start trading with minimal setup. However, with simplicity comes certain nuances that you should be aware of to maximize the effectiveness of this strategy.
Firstly, it’s important to note that this strategy is inherently a scalping method. The combination of Heiken Ashi and TDI indicators tends to generate signals that require quick entry and exit, which can lead to frequent trades. This characteristic, while potentially profitable, also increases the risk of overtrading. To mitigate this, it’s crucial to set specific trading sessions where you focus on executing trades. By limiting your active trading hours, you can maintain discipline and prevent burnout, which is a common pitfall for scalpers.
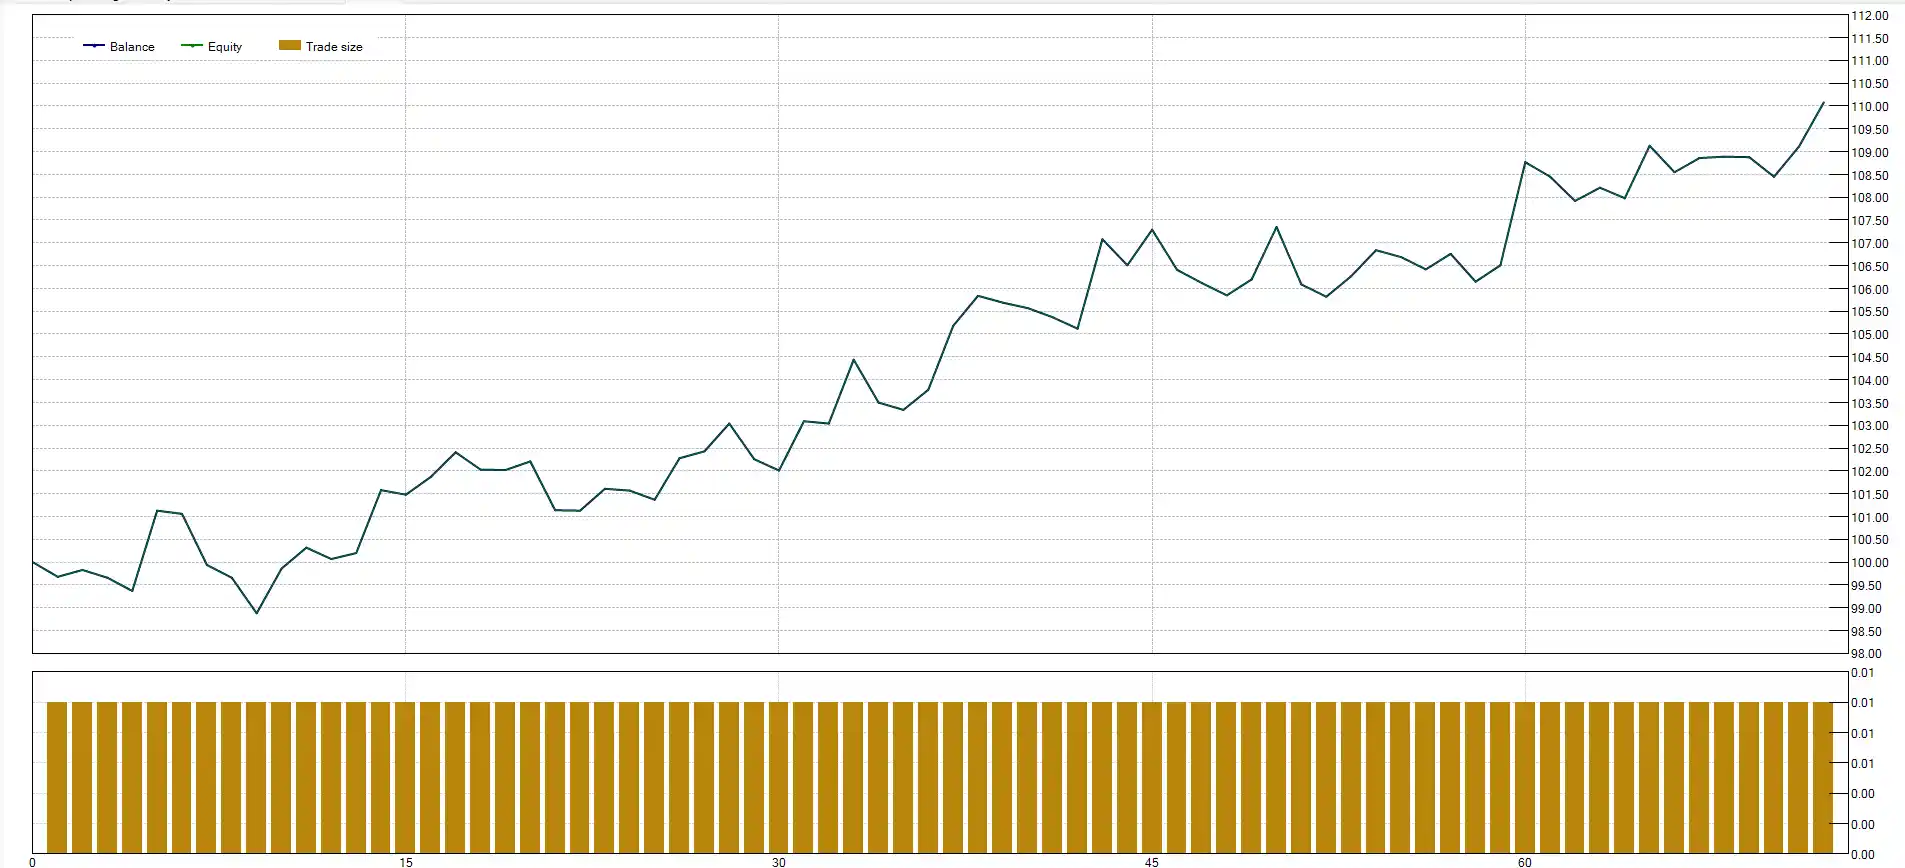
Moreover, small losses are an inevitable part of this strategy. Given the rapid nature of scalp trading, there will be times when the market moves against your position, triggering a quick exit. However, there’s no need to be overly concerned about these small setbacks. The real strength of the Heiken Ashi and TDI strategy lies in its ability to capture significant trends. One strong trend can easily compensate for several minor losses, so maintaining a long-term perspective is key.
Another important consideration is the potential for false signals. Like all indicators, Heiken Ashi and TDI are not infallible. They can sometimes produce misleading signals that may tempt you into premature trades. To counter this, it’s advisable to wait for one or two additional candles after receiving a signal before entering a trade. This brief pause can help confirm the strength of the signal and reduce the likelihood of entering a trade based on noise or market fluctuations.
Lastly, you might want to consider incorporating additional tools to enhance the reliability of your trades. While the Heiken Ashi and TDI indicators form the backbone of this strategy, using supplementary indicators like moving averages or support and resistance levels can provide extra confirmation. This layered approach can improve your confidence in the trades you take and help you filter out less reliable signals.
In conclusion, while the best tdi strategy is simple and effective, it requires a disciplined approach and a clear understanding of its strengths and limitations. By recognizing these key points and applying them diligently, you can harness the full potential of this strategy to achieve consistent results in the forex market.
Backtest Results of the Heiken Ashi and TDI Trading Strategy
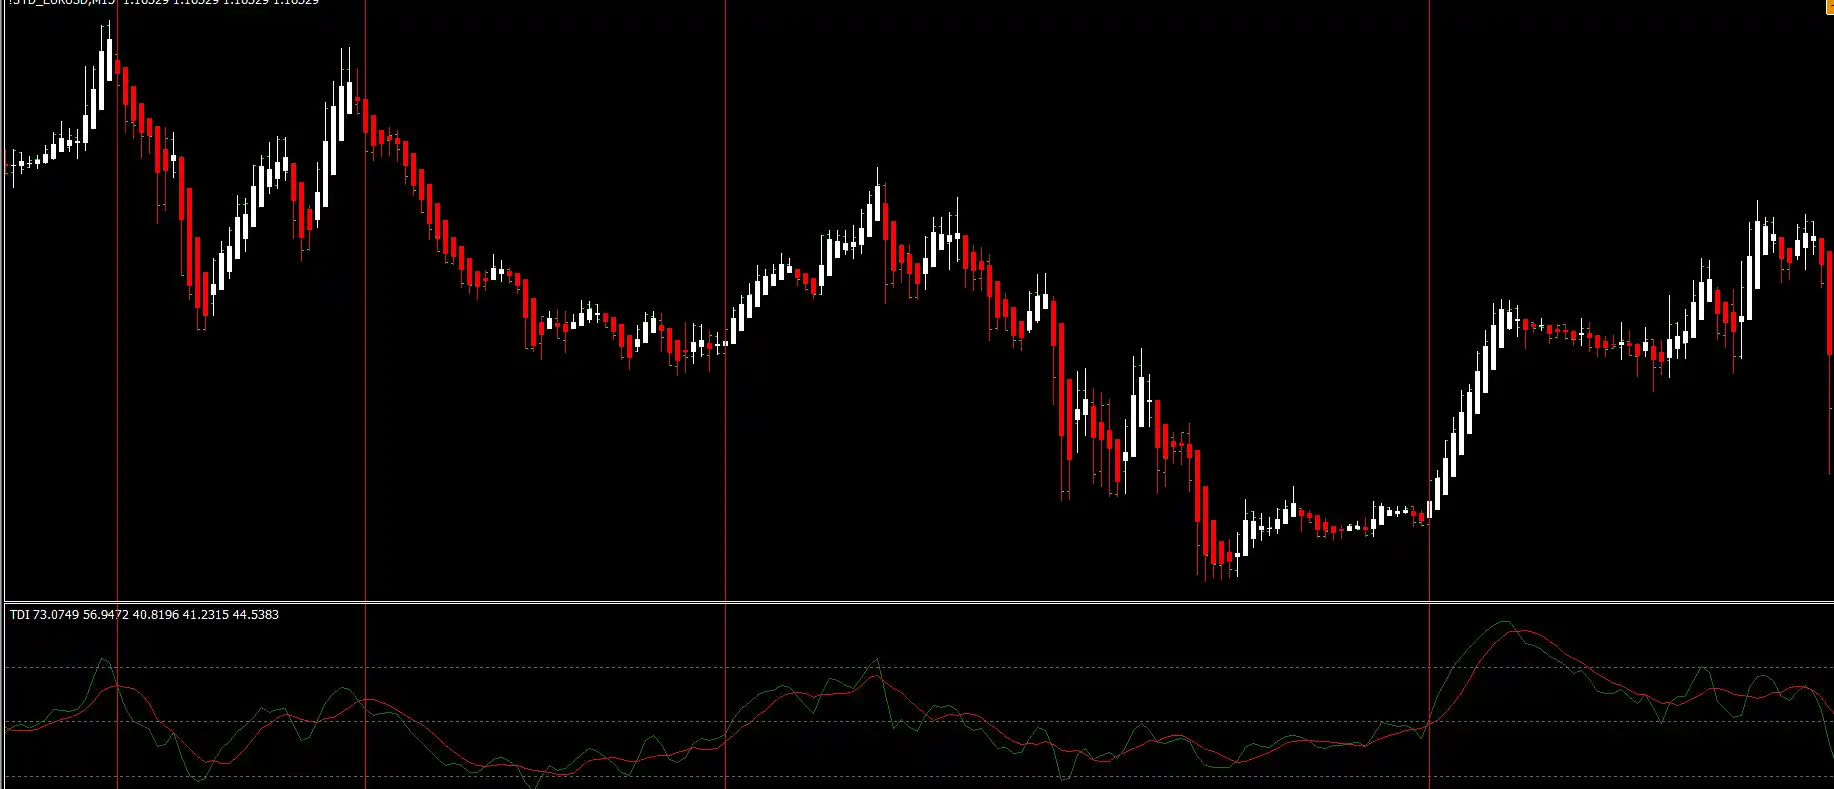
In the world of trading, a backtest is often the ultimate litmus test for a strategy’s effectiveness. At PicoChart, we are committed to providing profitable and reliable trading strategies, and a crucial part of this commitment is the thorough evaluation of each system before it’s presented to our audience. We don’t just share strategies; we test them rigorously, gather data, and then provide those backtest results to our community, allowing traders to make informed decisions. Our recent backtest of the Heiken Ashi and TDI trading strategy is a perfect example of this approach.
For this particular backtest, we focused on the EURUSD currency pair over a one-week period from October 14th to October 21st, 2021, using the 15-minute timeframe. The results were both enlightening and encouraging. Over the course of this week, we executed 72 trades using the Heiken Ashi and TDI strategy. Out of these, 33 trades were profitable, while 39 resulted in losses. At first glance, the win-loss ratio might seem less than ideal, but what’s particularly fascinating is the overall profitability despite the higher number of losing trades.
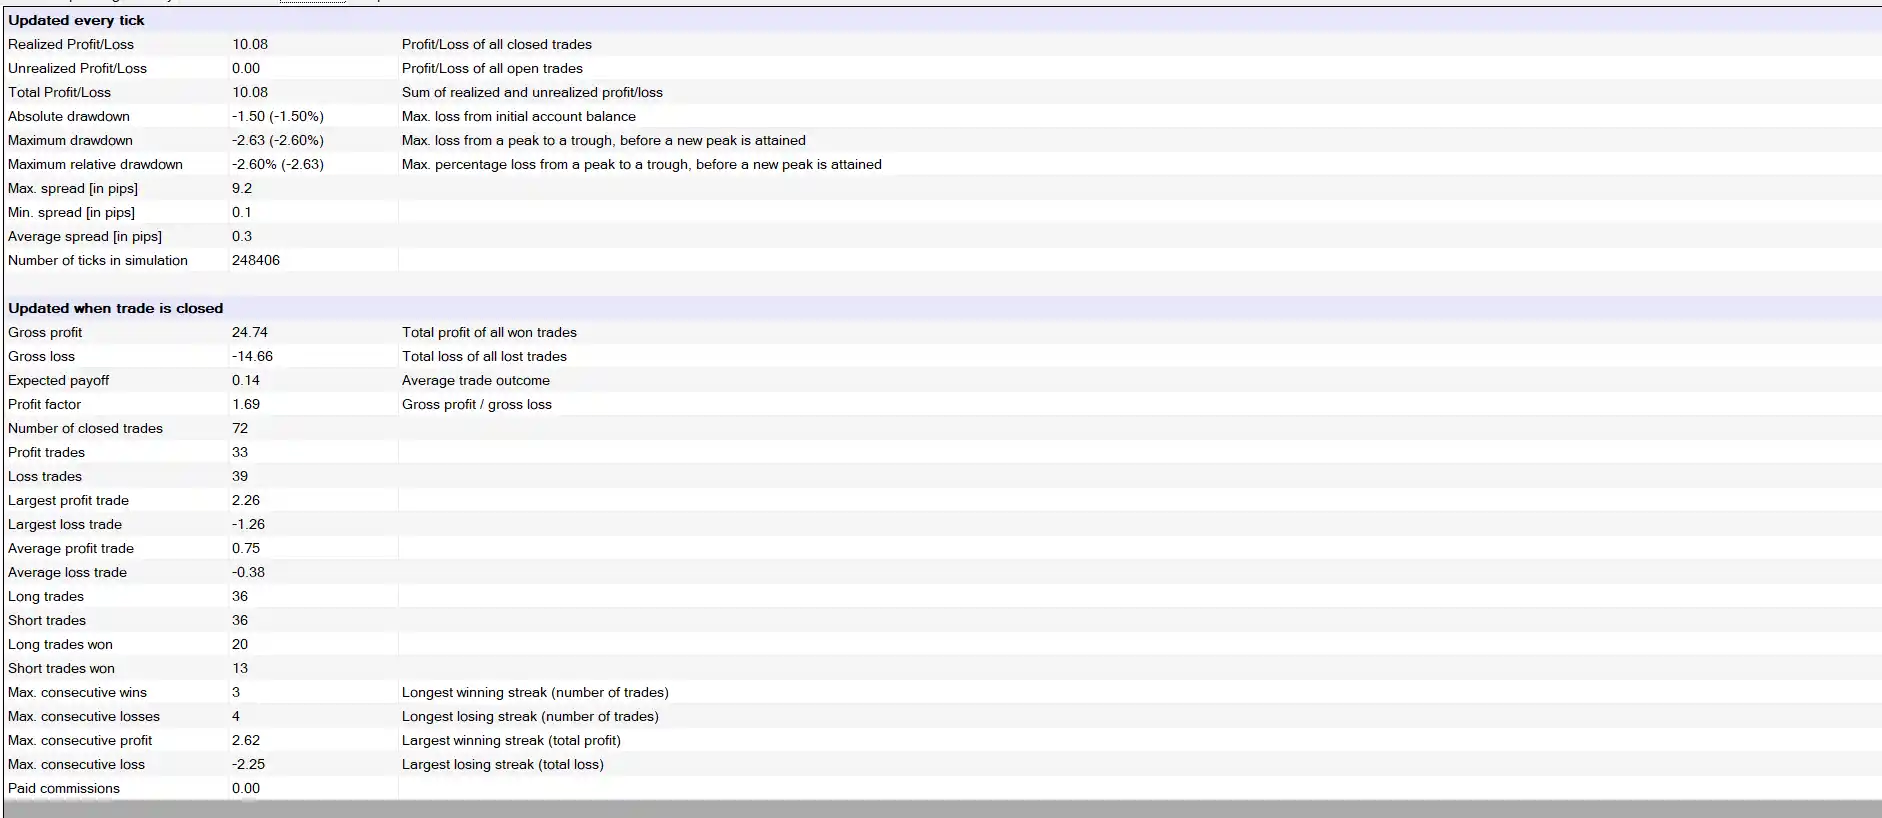
The key lies in the profit-to-loss ratio. The average profit per trade was $0.75, while the average loss was only $0.38. This 2:1 profit-to-loss ratio played a crucial role in the strategy’s overall success. Even though there were more losing trades, the strategy still managed to achieve a 10% profit in just one week, trading a single currency pair with a very conservative trade size of 0.01 lots. This suggests that with appropriate risk management and capital allocation, the strategy could yield even greater returns when scaled up.
It’s important to remember that while these results are promising, they are based on a specific time period and market conditions. Market dynamics can change, and no strategy is infallible. That’s why we always encourage our users to perform their own backtests and demo trades before fully committing to any trading strategy. It’s also essential to understand that trading inherently involves risks, and while backtests can provide insights, they are not guarantees of future performance.
At PicoChart our role is not to recommend or dismiss any particular strategy but to provide you with the tools and data to make your own informed decisions. We strongly advise that you take the time to understand any strategy thoroughly, test it in a demo account, and refine it according to your unique trading style and risk tolerance. The responsibility for any profits or losses you incur ultimately rests with you, and we are here to support you on your trading journey with unbiased information and resources.
maybe useful for you:

