best RSI and Moving Average Scalping Strategy | win rate:68% + back test
Navigating the intricate world of Forex trading can feel like a daunting journey, especially for newcomers. One of the most pressing challenges is finding a strategy that is both simple and effective. If you’re just stepping into the dynamic arena of financial markets, you might often find yourself overwhelmed by the complexity and multitude of trading strategies out there. Fear not, as in this article, we aim to introduce you to one of the simplest and most efficient trading strategies that you can easily master and implement.
This straightforward strategy revolves around using the RSI (Relative Strength Index) indicator alongside three Exponential Moving Averages (EMA). It’s designed to be versatile and user-friendly, allowing you to execute it on any trading platform, including the mobile version of MetaTrader. This flexibility makes it an ideal and practical approach for many traders. So, if you’re eager to learn about this unique strategy, stay with us until the end of this article. Additionally, we have included the backtest results in the final section, enabling you to effortlessly evaluate its effectiveness.

This RSI and EMA strategy is particularly noteworthy due to its simplicity and efficiency, making it a popular choice for those interested in moving average scalping. By integrating the best EMA for scalping with the RSI, this strategy provides a powerful tool for traders looking to capitalize on quick market movements. Whether you’re employing the triple EMA scalping method or exploring the best moving average strategy for scalping, this approach can be tailored to meet your trading needs. Get ready to dive into the details and discover how this strategy can enhance your trading experience.
An Overview of the Moving Average and RSI Scalping Strategy
Imagine having the tools to decipher market movements with precision and make informed trading decisions quickly. That’s the essence of the Moving Average (MA) and Relative Strength Index (RSI) indicators. These two powerful tools form the backbone of our scalping strategy. The Moving Average smooths out price data to create a single flowing line, making it easier to identify trends and reversals. The RSI, on the other hand, is a momentum oscillator that measures the speed and change of price movements, helping traders identify overbought or oversold conditions.
The structure and functionality of these indicators are designed to complement each other perfectly. Moving Averages, particularly the Exponential Moving Average (EMA), respond more quickly to recent price changes, providing timely signals for entry and exit points. The RSI, calculated by comparing the magnitude of recent gains to recent losses, offers insight into potential market reversals. When combined, the RSI and EMA create a robust framework for a scalping strategy that is both efficient and reliable.
This strategy is not only simple but also versatile, suitable for both low and high time frames. Whether you’re using the 1-minute or the 1-hour chart, the Moving Average RSI strategy can be tailored to your trading style. It boasts a success rate of over 50%, making it one of the best moving average strategies for scalping. The RSI and Moving Average strategy can be applied across various market conditions, providing traders with a reliable tool to navigate the complexities of Forex and other trading markets.
Necessary Tools for the RSI and Moving Average Scalping Strategy
Embarking on this scalping journey requires minimal but essential tools. All you need are two key indicators: the Relative Strength Index (RSI) and the Moving Average (MA). Set up your chart with these indicators, and switch your chart display to candlestick format for better visualization. This simple setup allows you to harness the power of the RSI and EMA, enabling you to execute the strategy efficiently on any trading platform, including mobile versions. The simplicity of these tools combined with their effectiveness makes this strategy accessible and highly effective for traders at all levels.
Best Settings for RSI and Moving Average Indicators for Trading
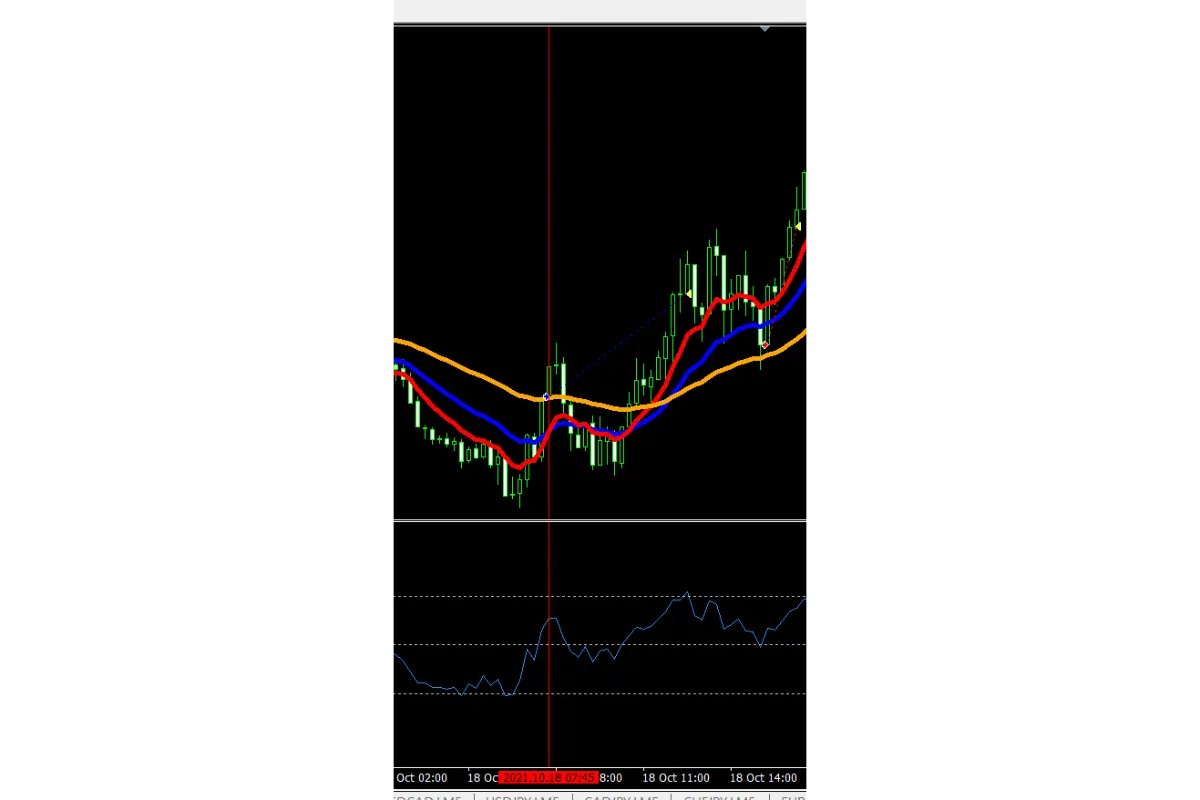
Setting up your indicators correctly is crucial for executing the 1-minute scalping strategy effectively. Fortunately, this process is straightforward. For the RSI (Relative Strength Index), you can use the default settings, but with an important addition: you need to add a level of 50. This can be done in the settings under the ‘Levels’ tab, where the default levels are set at 30 and 70. Adding the 50 level helps in identifying the midpoint, which is essential for this strategy. Alongside the RSI, you’ll need three Exponential Moving Averages (EMA) on your chart. Set their periods to 50, 20, and 9. It’s beneficial to use different colors for each EMA to easily distinguish between them. Remember, setting the moving average type to exponential is crucial for capturing the most recent price changes effectively. This combination of settings creates a robust framework for the moving average and RSI strategy, enhancing its effectiveness.
Suitable Time Frames for the Triple Moving Average and RSI Scalping Strategy
One of the greatest strengths of the Triple EMA and RSI strategy is its versatility across various time frames. While this strategy is effective on all time frames, it truly shines in lower time frames due to its scalping nature. For optimal results, we recommend using 1-minute, 5-minute, 15-minute, and 30-minute charts. These shorter intervals allow traders to capitalize on quick market movements, making it ideal for those who prefer a fast-paced trading environment. This flexibility makes it one of the best EMA strategies for scalping, providing a practical approach for traders looking to maximize their trading efficiency.
How the RSI and Moving Average Scalping Strategy Works
Now, it’s time to delve into how to execute the RSI and Moving Average scalping strategy effectively. The setup and execution of this strategy are straightforward, making it accessible even for novice traders. Here, we outline two main approaches: buying and selling.
Buy Trade
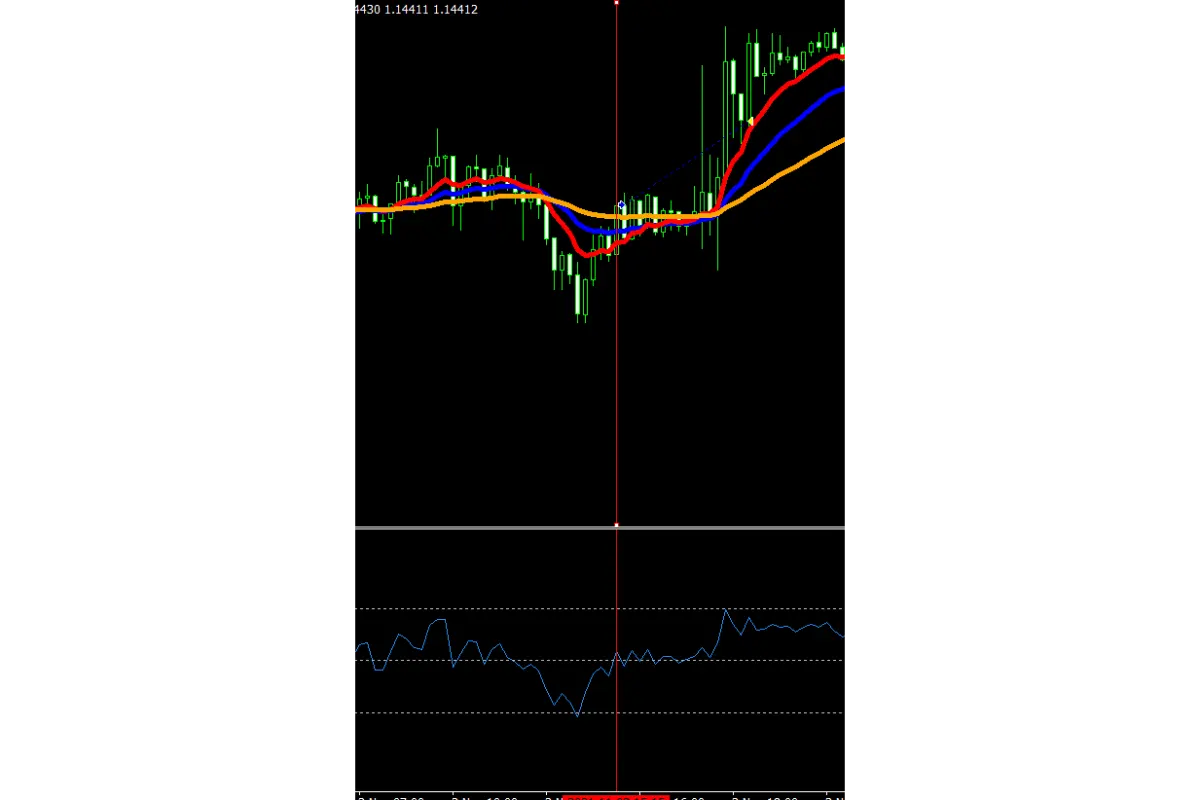
In a strong downtrend, the three Exponential Moving Averages (EMA) will often diverge from each other and the price candles. This divergence indicates that the price is likely to revert to the mean, or “snap back” towards the EMAs. When the price begins to revert and the RSI crosses above the 50 line from below, it’s a signal to enter a buy trade. The greater the distance between the price and the EMAs, the more reliable the signal. This is because a larger gap suggests a stronger reversion potential.
Sell Trade
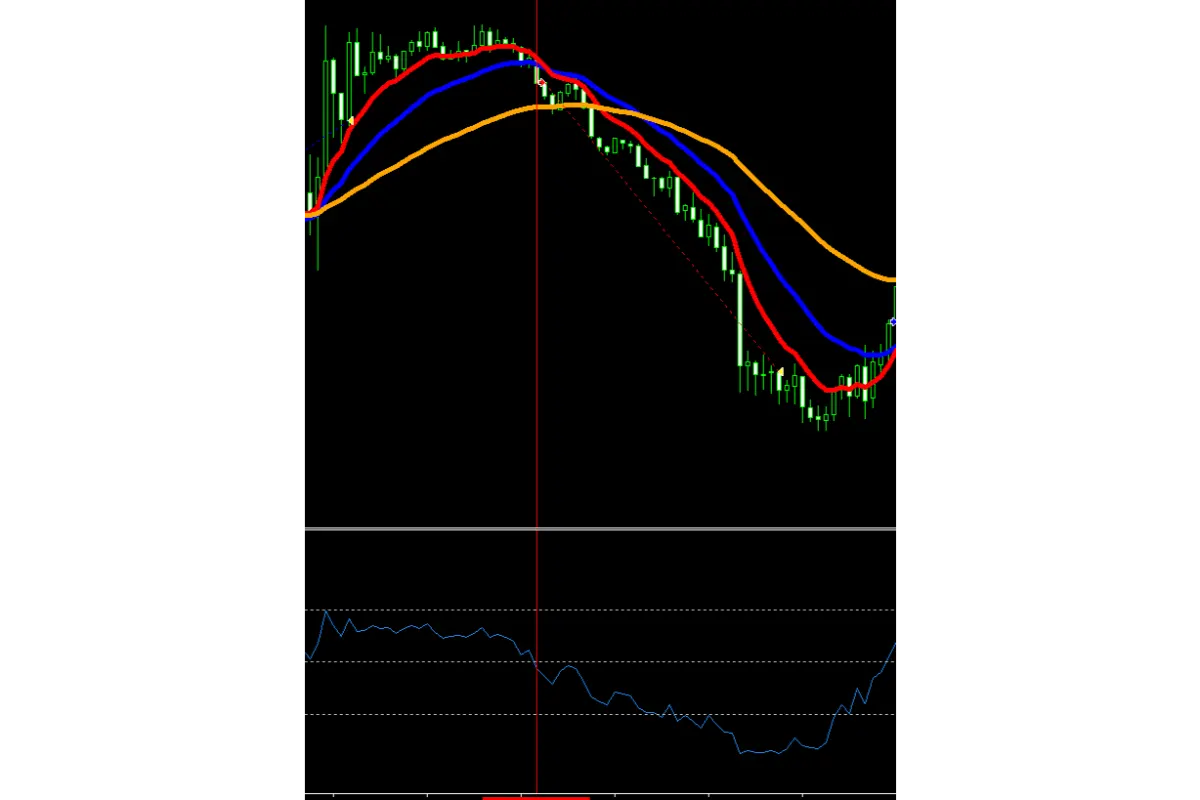
Conversely, in a strong uptrend, the three EMAs will diverge from each other and the price candles. This scenario indicates that the price is likely to correct downwards towards the EMAs. When the price starts to decline and the RSI crosses below the 50 line from above, it’s a signal to enter a sell trade. Again, the greater the distance between the price and the EMAs, the stronger the signal, as it indicates a higher likelihood of a significant price correction.
Take Profit
The take profit level in this strategy is typically based on each trader’s risk management approach. However, it is generally advisable to exit the trade upon observing candle weakness or achieving a one-to-one profit target. Remember, this is a scalping strategy designed to capture quick gains rather than long-term trends. Thus, after a few profitable candles, it’s wise to close the position to lock in gains.
Stop Loss
For stop-loss placement, traders can use candle weakness or stochastic indicator reversals. Alternatively, you can set your stop loss based on personal risk management rules or a one-to-one ratio. The key is to protect your capital while allowing room for the strategy to work effectively.
By following these straightforward steps, traders can implement the RSI and EMA strategy to maximize their scalping potential. Whether you’re using the 1-minute scalping moving average approach or adapting it to slightly longer time frames, this method offers a structured path to consistent trading success.
Key Points to Consider for the RSI and Triple Moving Average Scalping Strategy
As you’ve likely gathered, the RSI and Triple Moving Average strategy is not only intriguing but also highly accessible, allowing traders of all levels to utilize it effectively. However, to truly optimize this strategy and enhance your trading results, there are several important points to keep in mind.
Firstly, ensure that you enter trades only after a strong trend has occurred. The most reliable signals often arise following a significant trend, as the price is more likely to pull back and rest after a substantial move. This pullback or reversion increases the chances of a successful trade. By waiting for these conditions, you increase the probability of your trades aligning with the natural ebb and flow of the market.
Secondly, consider incorporating the Stochastic Oscillator into your strategy to improve accuracy and reduce false signals. The Stochastic Oscillator can complement the RSI and EMA setup by providing additional confirmation. This combination is known as the “RSI and Stochastic Scalping Strategy” which we’ve detailed in a separate article for those interested in a more comprehensive approach. By using these indicators together, you can filter out weaker signals and focus on the more robust opportunities.
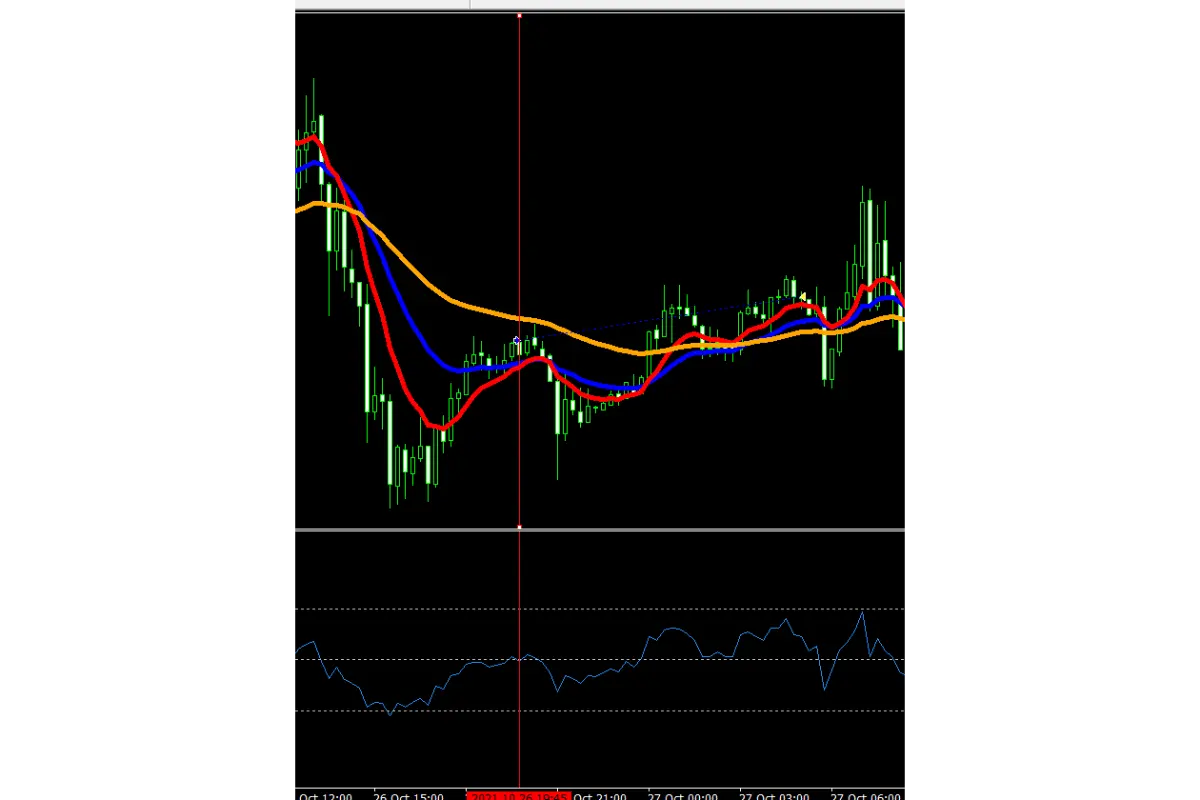
Moreover, it’s crucial to recognize that the price often makes a minor retracement before continuing in the intended direction after a signal is generated. Don’t be alarmed if the price initially moves against your position. Instead, set your exit point just below the last significant high or low, allowing some room for natural market fluctuations without prematurely closing your trade.
Another key point is to practice disciplined risk management. Given that this is a scalping strategy, positions are held for shorter durations, and the market can be volatile. It’s essential to set stop-loss orders and adhere to them strictly. This will protect your capital and prevent substantial losses that could arise from sudden market movements.
Finally, continuously monitor and adapt your approach. Markets are dynamic, and while the RSI and Triple EMA strategy is robust, it’s not foolproof. Regularly reviewing your trades, identifying what works, and adjusting as necessary will help you stay ahead. Use backtesting to validate your strategy and ensure it remains effective under different market conditions.
By keeping these tips in mind and consistently applying them, you can significantly enhance the performance of the RSI and Triple Moving Average scalping strategy. This method is versatile and can be adapted to various market conditions, making it a valuable tool in any trader’s arsenal.
Backtest Results of the RSI and Triple Moving Average Scalping Strategy
Backtesting is an essential tool for evaluating the effectiveness of a trading strategy. At PicoChart, we are committed to providing profitable and efficient trading strategies, as well as rigorously examining popular trading systems. We thoroughly test each strategy before presenting it to our audience, and we share the backtest results to help traders make more informed decisions. In line with this commitment, we conducted a backtest of the RSI and Triple Moving Average Scalping Strategy. The results are detailed below, illustrated with relevant images.
This backtest was performed on the EURUSD currency pair over a one-month period from October 14, 2021, to November 14, 2021. The chosen timeframe for this test was 15 minutes.

As shown in the images above, we executed 25 trades using this strategy during the specified period. Out of these, 17 trades were profitable, while only 8 resulted in losses, yielding a win rate of 68%. The average profit per trade was $8.81, and the average loss per trade was $6.61, resulting in a reward-to-risk ratio of 1.3. This means that, on average, the profit from each successful trade was 1.3 times the loss from losing trades. For this backtest, the exit point was set at the previous peak or trough.
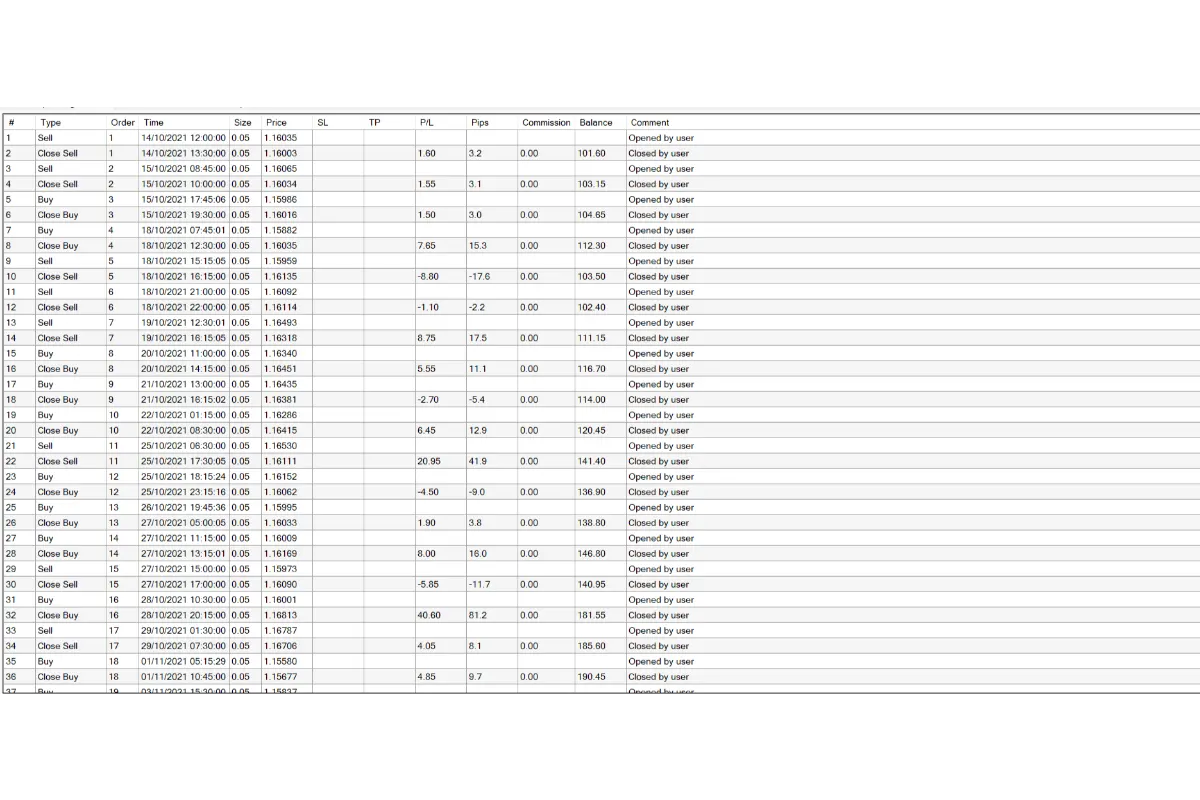
The backtest demonstrates the robustness of this strategy, showcasing a high win rate and a favorable reward-to-risk ratio. This strategy proves to be a reliable tool for traders looking to capitalize on market movements within a short timeframe. However, it is important to remember that past performance is not indicative of future results, and continuous monitoring and adjustment are necessary for consistent success.
Warning: Please note that PicoChart neither endorses nor dismisses any particular strategy. It is crucial for traders to choose a strategy based on their experience and knowledge, and to thoroughly test it in a demo account and through various backtests before applying it in live trading. Therefore, all profits or losses incurred are solely the responsibility of the trader, and PicoChart assumes no liability in this regard.
FAQ
Q1: What is the RSI and Triple Moving Average Scalping Strategy?
A1: It’s a trading strategy that uses the RSI and three exponential moving averages to identify buy and sell signals.
Q2: What are the best settings for the RSI and moving averages in this strategy?
A2: Use the default settings for the RSI with an added level of 50, and set three exponential moving averages at periods of 9, 20, and 50.
Q3: On which timeframes is this strategy most effective?
A3: While it works on all timeframes, it is ideal for lower timeframes such as 1 minute, 5 minutes, 15 minutes, and 30 minutes.
Q4: What were the results of the backtest on the EURUSD pair?
A4: The backtest showed a 68% win rate with an average profit of $8.81 and an average loss of $6.61.

