kijun sen cross trading strategy |win rate: 63% + backtesting
In the vast world of trading, where strategies and tools are abundant, finding a method that balances simplicity with effectiveness can be challenging. However, the Ichimoku Kinko Hyo, commonly known as the Ichimoku Cloud, stands out as one of the most powerful indicators for identifying long-term trends. This indicator, with its various components, offers a comprehensive view of the market, making it invaluable for traders. Among its components, the Kijun Sen—often referred to as the baseline—shines as a key element that effectively highlights market trends. When you combine two Kijun Sen lines, the result can be nothing short of extraordinary.
In this article, we aim to introduce one of the simplest yet highly effective strategies in the trading world: the Kijun Sen trading strategy. This strategy relies solely on the Ichimoku Cloud and its Kijun Sen line, making it accessible across all trading platforms. Its straightforward nature is precisely what makes this strategy ideal and highly efficient. So, if you’re eager to discover this unique and powerful approach, stay with us until the end of this article. We’ve also included the results of a backtest at the conclusion, allowing you to easily evaluate its effectiveness.
Overview of the Kijun Sen Trading Strategy
Imagine having a tool that not only simplifies your trading decisions but also provides you with a reliable method to follow market trends. The Ichimoku Cloud, an all-encompassing indicator, is just that—a powerful tool designed to give traders a clear picture of market dynamics. Among its components, the Kijun Sen, or baseline, plays a pivotal role. This line, calculated as the average of the highest high and lowest low over a specified period, acts as a key support and resistance level, helping traders identify potential trend reversals and continuations. The simplicity and effectiveness of the Kijun Sen are what make it a cornerstone of many successful trading strategies.
When we talk about the Kijun Sen trading strategy, we’re referring to a method that leverages the strengths of the Ichimoku Cloud, particularly the Kijun Sen line. This strategy is not only straightforward but also remarkably versatile. It can be applied across various timeframes, making it suitable for both short-term and long-term traders. Whether you’re navigating the fast-paced world of lower timeframes or seeking to capitalize on longer-term trends, the Kijun Sen cross strategy offers a balanced approach that adapts to different market conditions.
Moreover, this strategy boasts an impressive success rate. On average, the Kijun Sen strategy achieves a win rate of over 50%, making it a robust option for traders across different markets. Its effectiveness in identifying and following trends makes it a complete Ichimoku cloud trading strategy that meets the needs of traders, whether they are dealing with forex, stocks, or commodities. This double Ichimoku strategy truly stands out as one of the best options available, offering a reliable way to navigate the complexities of the trading world.
Tools Required for the Kijun Sen Trading Strategy
The beauty of the Kijun Sen trading strategy lies in its simplicity. You don’t need a complex array of tools or indicators to execute this strategy effectively. All you need is to place two Ichimoku indicators on your chart—nothing more, nothing less. This straightforward approach is what makes the Kijun Sen strategy so accessible and popular among traders. The power of this strategy comes from its ability to leverage the Ichimoku trend following principles, particularly the Kijun Sen, to identify strong trading opportunities without overwhelming you with unnecessary complexity. Below, we’ve provided these indicators for your convenience, so you can easily set them up and start using this highly efficient and complete Ichimoku cloud trading strategy.
Optimal Settings for the Kijun Sen or Baseline Indicator
When it comes to setting up the Kijun Sen cross strategy, simplicity is key. There’s no need for intricate configurations. Start by placing two Ichimoku indicators on your chart, but here’s the trick—remove all components except for the Kijun Sen lines. You can do this by setting the color of the other elements to “none” in the color settings, effectively making them disappear. Next, adjust the period of one Kijun Sen to 88 and the other to 52. Just like that, your chart is ready for trading with this efficient and straightforward double Ichimoku strategy. This minimalistic approach ensures that your focus remains on the crucial signals provided by the Kijun Sen lines, making it a powerful yet easy-to-use complete Ichimoku cloud trading strategy.
Ideal Timeframes for the Kijun Sen Cross Strategy
The beauty of the Kijun Sen cross strategy lies in its versatility—it works effectively across all timeframes. However, given that this is a trend-following strategy, it tends to perform exceptionally well on the 15-minute chart, where you can capitalize on short-term trends with precision. If you’re short on time or prefer a more relaxed trading approach, you can also apply this strategy on higher timeframes like the 4-hour or daily charts. Regardless of the timeframe you choose, the Kijun Sen trading strategy adapts seamlessly, allowing you to follow the market trends with confidence and efficiency, making it a truly complete Ichimoku cloud trading strategy.
How the Kijun Sen Trading Strategy Works
Now, let’s delve into the mechanics of trading with the Ichimoku indicator and its Kijun Sen line. The setup for this strategy is remarkably straightforward, yet it provides clear and actionable signals. Below, we outline two primary trading methods using this strategy:
Buy Trade
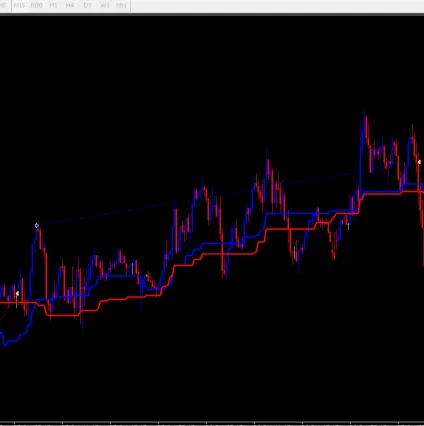
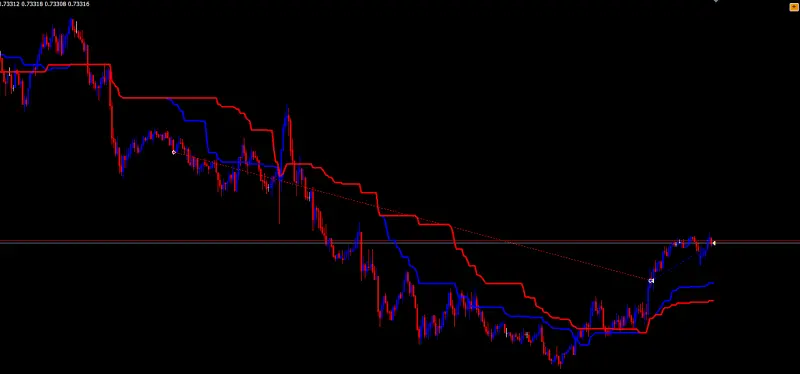
When the 52-period Kijun Sen crosses above the 88-period Kijun Sen and the price is above both lines, it’s a signal to enter a buy trade. This setup indicates a strong bullish trend, making it an ideal entry point in this Kijun Sen trading strategy.
Sell Trade
Conversely, if the 52-period Kijun Sen crosses below the 88-period Kijun Sen and the price is below both lines, you can confidently enter a sell trade. This setup is a clear indication of a bearish trend, which is central to the effectiveness of this double Ichimoku strategy.
Take Profit
The take profit level for this strategy typically depends on each trader’s risk management plan. However, a common approach is to exit the trade when you notice candlestick weakness or once the price reaches a one-to-one risk-to-reward ratio.
Stop Loss
For the stop loss, traders often rely on candlestick weakness or a Kijun Sen reversal as their signal to exit. You can also set it according to your personal trading plan or use a one-to-one risk-to-reward ratio to maintain consistency.
This Kijun Sen cross strategy is designed to be simple yet effective, enabling traders to leverage the complete Ichimoku cloud trading strategy with precision and confidence. By following these clear rules, you can navigate the markets with a powerful trend-following tool at your disposal.
Key Points to Consider in the Kijun Sen Cross Strategy
As we’ve explored, the Kijun Sen cross strategy is incredibly simple in its structure, making it accessible to traders of all experience levels. This simplicity is one of its most attractive features, allowing even those new to trading to quickly grasp its mechanics. However, there are a few critical aspects to keep in mind to maximize its effectiveness and ensure consistent success in your trading journey.
Firstly, it’s important to note that the Kijun Sen indicator, like the broader Ichimoku system, is designed to filter out market noise. This means that small price fluctuations won’t significantly impact the position of the Kijun Sen lines. Don’t be alarmed if minor market movements don’t trigger immediate changes—this is a feature, not a flaw. It ensures that the strategy remains focused on capturing meaningful trends, which is the core of any successful trend-following strategy, including this complete Ichimoku cloud trading strategy.
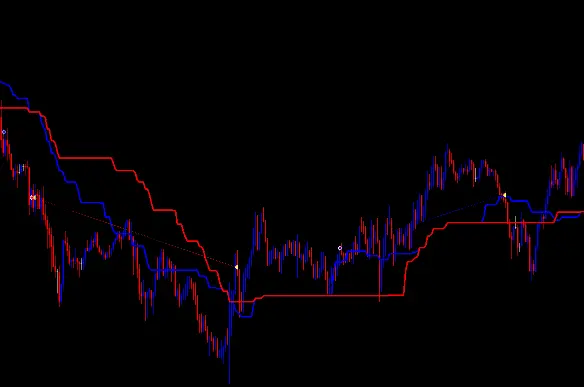
Secondly, safeguarding your profits should always be a priority. The financial markets are inherently volatile, and trends can reverse quickly. To ensure that you preserve the gains you’ve made, it’s wise to regularly lock in profits, especially when using this Kijun Sen trading strategy. Remember, the primary rule in trading is to protect your capital. By securing profits, you not only grow your account but also shield yourself from sudden market reversals that could erode your gains.
In addition to the core strategy, consider using supplementary tools to enhance your decision-making. One effective approach is to incorporate the MACD (Moving Average Convergence Divergence) indicator into your chart. By doing so, you can use the phase shifts in MACD as an additional signal for exiting trades. When the MACD shows a change in momentum or crosses the zero line, it can serve as a confirmation to close your position, ensuring that you exit the trade while the market is still in your favor. This combination of the Kijun Sen cross strategy with MACD offers a more robust framework for managing trades.
By integrating these considerations into your trading routine, you can leverage the full potential of the double Ichimoku strategy. The key is to remain disciplined, focus on preserving capital, and use additional indicators like MACD for enhanced trade management. With these strategies, you’re well-equipped to navigate the markets confidently and effectively.
Backtest Results for the Kijun Sen Cross Trading Strategy
Backtesting is one of the most effective ways to evaluate the potential success of a trading strategy before applying it to live markets. At PicoChart, we are committed to providing profitable and reliable trading strategies, ensuring that each one is thoroughly tested before it is recommended. Our approach involves conducting a comprehensive backtest, allowing traders to make informed decisions based on historical performance data. In line with this commitment, we have conducted a detailed backtest of the Kijun Sen Cross Trading Strategy, with the results presented in the images below.
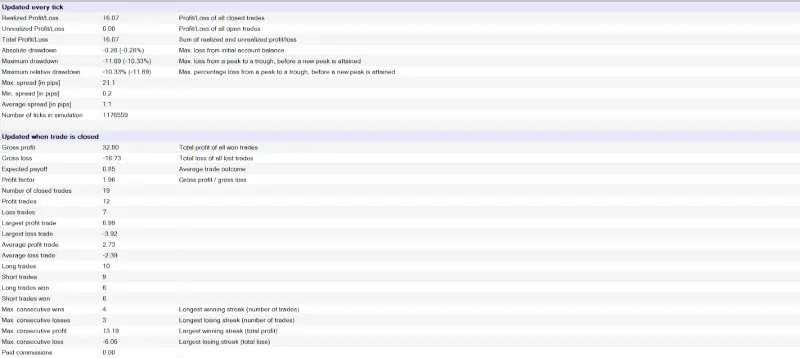
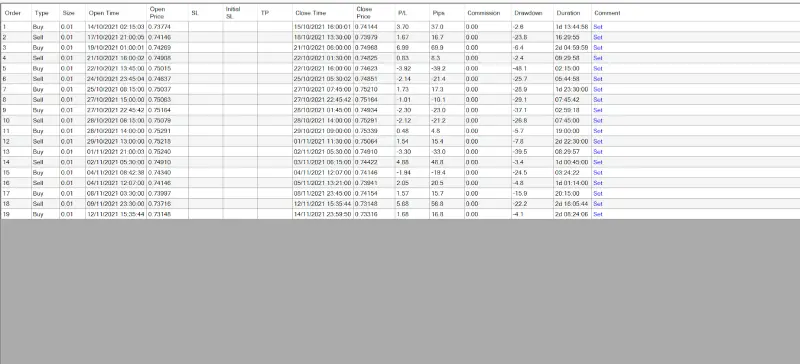
For this backtest, we focused on the AUD/USD currency pair over a one-month period, from October 14, 2021, to November 14, 2021, using a 15-minute timeframe. This timeframe was selected to capture the strategy’s effectiveness in short-term trading environments, particularly given that the Kijun Sen Cross is designed to identify trend-following opportunities. Over the course of this month, we executed 19 trades using the strategy. Of these, 12 were profitable, while 7 resulted in losses, yielding a win rate of 63%. This performance is noteworthy, especially considering the strategy achieved a 16% profit on just a single currency pair in one month.
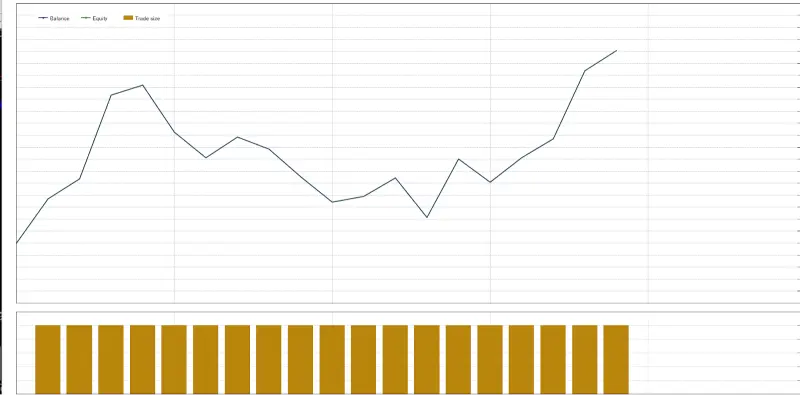
What makes this result even more compelling is the average profit and loss per trade. The average profit per trade was $2.73, while the average loss was $2.39. This indicates a profit-to-loss ratio slightly greater than 1:1, contributing to the strategy’s overall positive outcome. It’s important to note that our trading volume was limited to just 0.01 lots, which means that as your capital grows, you could scale up the trading volume to potentially enhance returns.
However, we must emphasize that while the results of this backtest are promising, they do not guarantee future success. The market conditions during the backtest period might differ from future conditions, and thus, the strategy’s performance may vary. Furthermore, we encourage traders to conduct their own backtests and trial runs on demo accounts before fully committing to any strategy in live trading.
Important Note: PicoChart does not endorse or reject any specific trading strategy. The responsibility for your trading decisions lies entirely with you, the trader. It’s essential to build your strategy based on your own knowledge and experience, conducting thorough backtesting and demo trading before taking it live. While we aim to provide valuable insights and tools, we are not liable for any profits or losses incurred from your trading activities.
This comprehensive backtest serves as a valuable reference point, helping you to understand how the Kijun Sen Cross Strategy could perform under specific market conditions. We encourage you to use this data wisely and continue refining your approach for optimal results in your trading journey.
maybe useful for you:

