RSI and Stochastic Scalping Strategy |winrate :+50| + backtest
Navigating the dynamic world of Forex and financial markets can be daunting for newcomers. One of the primary challenges is finding a simple yet effective trading strategy. In this article, we aim to introduce you to one of the simplest trading strategies available. This straightforward approach utilizes only two indicators: the RSI (Relative Strength Index) and the Stochastic Oscillator. Its simplicity and effectiveness make it suitable for all trading platforms, including the mobile version of MetaTrader. This factor alone makes it an ideal and efficient strategy for traders of all levels. If you’re keen to learn about this unique strategy, we invite you to join us throughout this article. Additionally, we’ve included the backtest results at the end of the article, so you can easily evaluate its performance.
Finding a reliable trading strategy is essential for success in the Forex market. The RSI and Stochastic Oscillator are powerful tools that can enhance your trading efficiency. The RSI, a popular momentum indicator, helps traders identify overbought and oversold conditions. It is widely used in both short-term and swing trading. The Stochastic Oscillator, another momentum indicator, complements the RSI by providing additional signals for entry and exit points. By combining these indicators, you can create a robust trading strategy that maximizes your chances of success. Whether you are new to Forex trading or looking to refine your skills, this strategy can provide a solid foundation for your trading endeavors.
Overview of the RSI and Stochastic Scalping Strategy
The RSI (Relative Strength Index) and Stochastic Oscillator are two of the most reliable indicators in the realm of technical analysis. The RSI, developed by J. Welles Wilder, is a momentum oscillator that measures the speed and change of price movements. It moves between 0 and 100, indicating overbought conditions when above 70 and oversold conditions when below 30. This makes it a valuable tool for identifying potential reversal points in the market, ideal for both short-term and swing trading.

On the other hand, the Stochastic Oscillator, introduced by George Lane, compares a particular closing price of an asset to a range of its prices over a certain period. This indicator oscillates between 0 and 100 and is used to identify overbought and oversold levels, typically using a threshold of 80 for overbought and 20 for oversold. The Stochastic Oscillator provides insights into potential price direction and momentum, making it highly effective in volatile market conditions, which is perfect for scalping.
Combining these two indicators results in a robust trading strategy that excels in both low and high time frames. The RSI’s ability to highlight overbought and oversold conditions, coupled with the Stochastic Oscillator’s momentum signals, creates a powerful synergy for scalpers. This strategy boasts a high success rate, often exceeding 50%, and can be applied across various trading markets. Whether you’re navigating Forex, stocks, or commodities, this strategy’s versatility and effectiveness make it one of the best options for traders seeking consistent results.
Tools Needed for the RSI and Stochastic Scalping Strategy
To implement this strategy, you don’t need any complex tools. Simply add the Relative Strength Index (RSI) and the Stochastic Oscillator to your chart. Ensure that your chart display is set to candlestick format, which provides clear visual cues for market movements. This straightforward setup allows you to focus on the signals generated by the RSI and Stochastic Oscillator, making it easier to execute trades with confidence and precision.
Best Settings for Stochastic and RSI Indicators for Trading
For a one-minute scalping strategy using the RSI and Stochastic indicators, simplicity is key. You can utilize the default settings for both indicators. However, for the RSI (Relative Strength Index), you need to add the 50 level to enhance its effectiveness. This can be done through the levels tab in the RSI settings, which typically come with the default levels of 30 and 70. Adding the 50 level helps identify the mid-point, offering a clearer signal for potential trade entries and exits. With these adjustments, you’ll have an optimal setup for your RSI strategy and stochastic strategy, ensuring you are well-equipped for precise and timely trades.
Suitable Time Frames for RSI and Stochastic Scalping Strategy
This strategy is versatile and effective across all time frames, but given that it is a scalping strategy, it excels in lower time frames. For optimal results, we recommend using one-minute, five-minute, fifteen-minute, and thirty-minute time frames. These shorter intervals allow traders to capitalize on quick price movements, making it ideal for those who prefer fast-paced trading environments. This flexibility ensures that whether you are engaging in quick scalping or looking at slightly longer short-term trades, the RSI and Stochastic combination will serve you well.
How the RSI and Stochastic Scalping Strategy Works?
Now, let’s dive into how the RSI and Stochastic scalping strategy operates. The setup and execution are straightforward, making it accessible even for beginner traders. Below, we outline two key trading methods using this strategy.
Buy Trade:
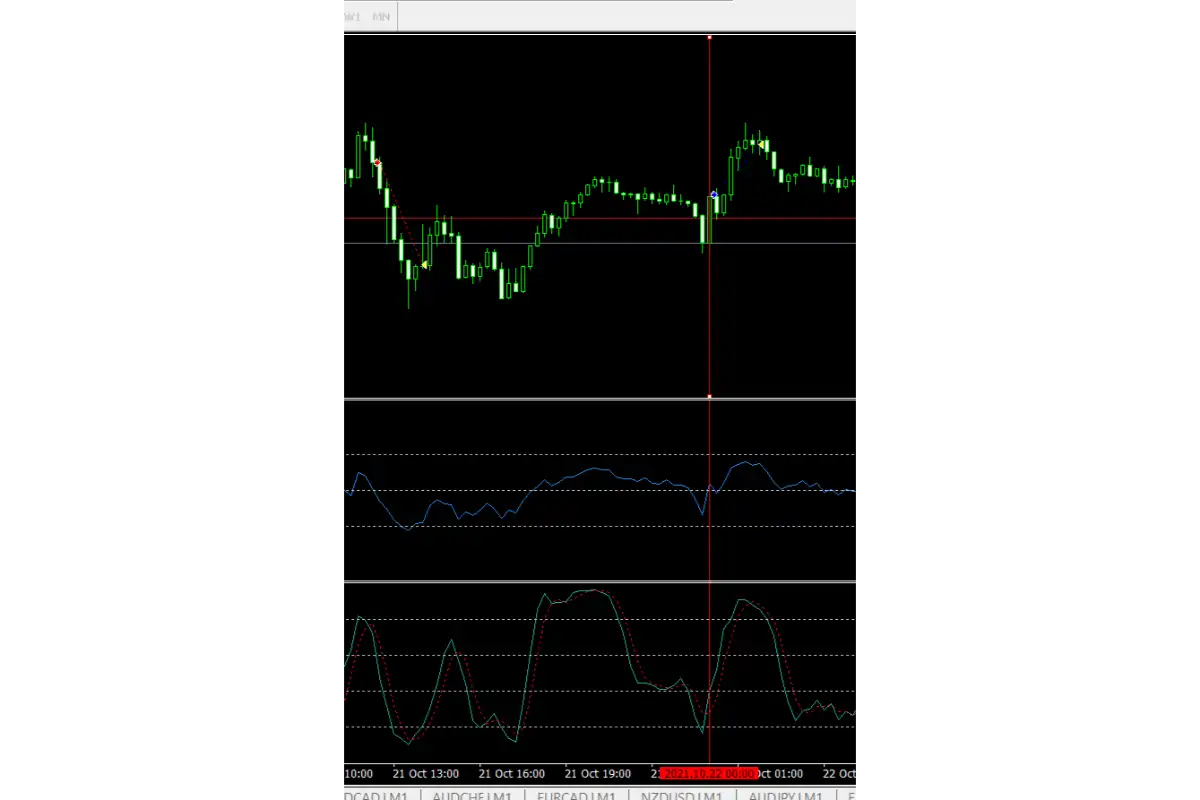
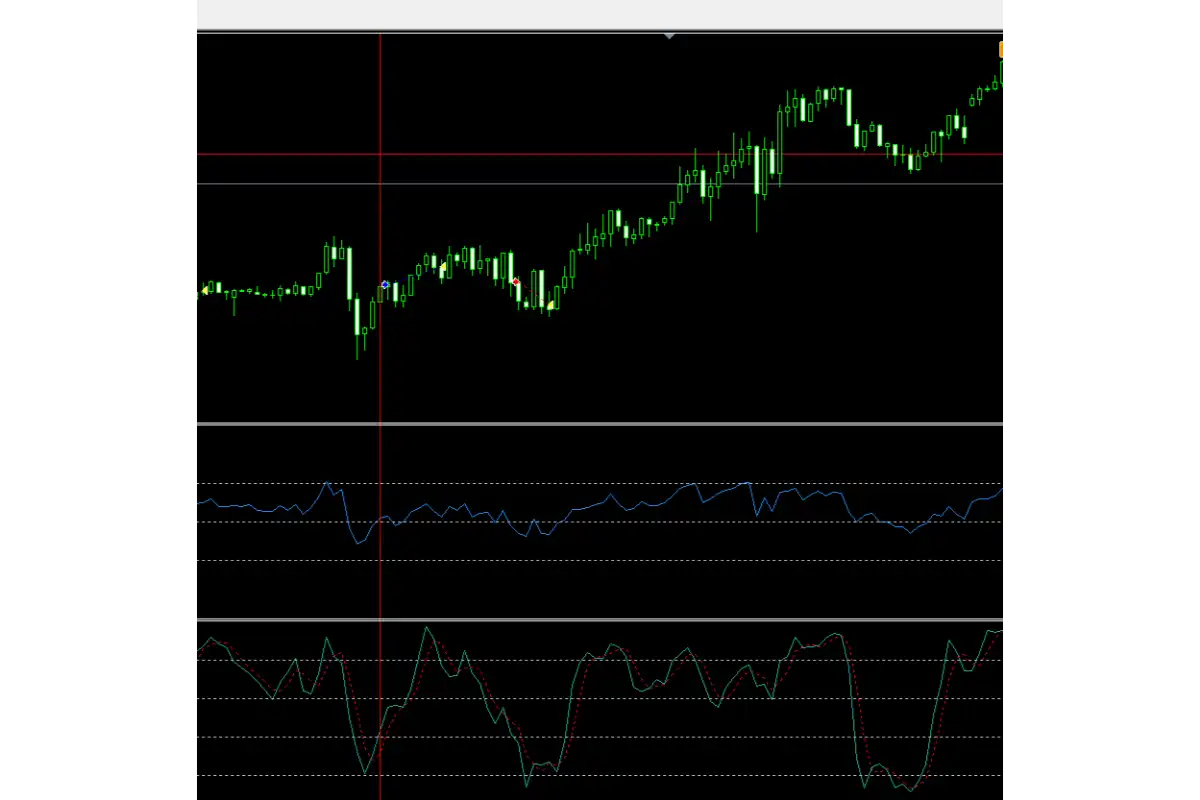
Initiate a buy order when the RSI (Relative Strength Index) crosses above the 50% level from below, signaling a potential upward momentum. Simultaneously, the Stochastic Oscillator should exhibit an upward trend. This dual confirmation from both indicators provides a strong buy signal, increasing the likelihood of a profitable trade.
Sell Trade:
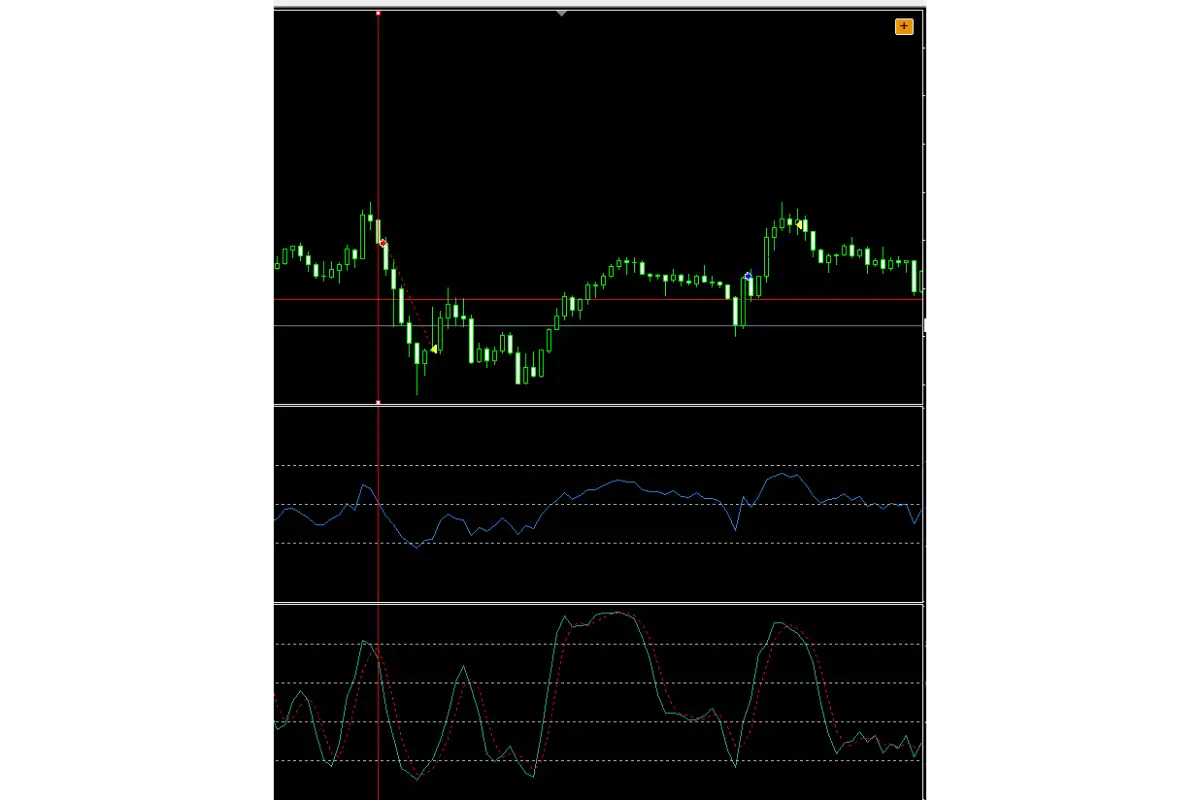
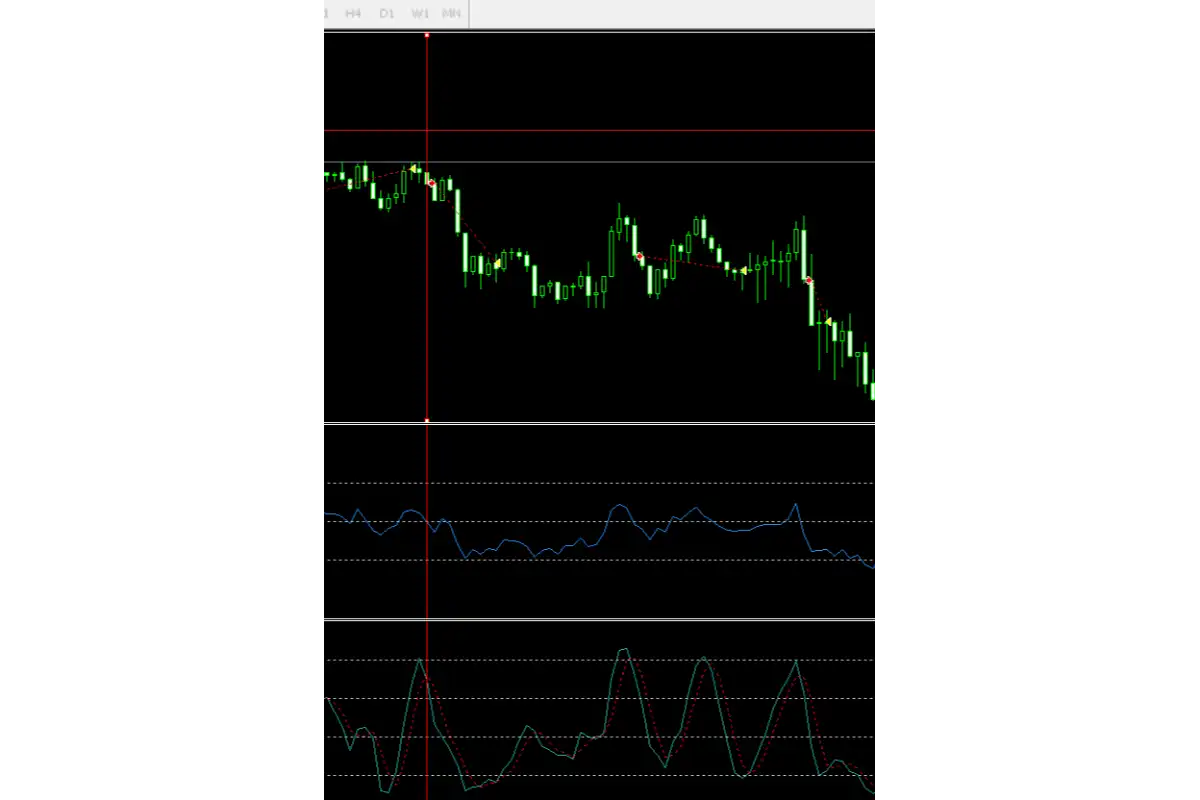
Place a sell order when the RSI crosses below the 50% level from above, indicating potential downward momentum. At the same time, the Stochastic Oscillator should be trending upwards but not in the overbought zone. This alignment ensures that you are entering a sell position with a high probability of success.
Take Profit:
The take profit level in this strategy largely depends on your personal risk management and trading plan. However, a common approach is to exit the trade upon observing a weakening candlestick pattern or achieving a one-to-one risk-to-reward ratio. This flexibility allows you to tailor the strategy to your specific trading goals.
Stop Loss:
For stop loss, you can use candlestick patterns indicating weakness or a reversal in the Stochastic Oscillator. Alternatively, you can set the stop loss based on your personal trading plan or maintain a one-to-one risk-to-reward ratio. This ensures that potential losses are minimized, preserving your trading capital.
By adhering to these straightforward rules, the RSI and Stochastic scalping strategy provides clear and actionable signals, enabling you to navigate the fast-paced Forex market with confidence and precision.
Important Tips for the RSI and Stochastic Scalping Strategy
As you have seen, the trading strategy using the RSI and Stochastic indicators is highly appealing. Its simplicity makes it accessible for traders of all levels. However, a few key tips can help you achieve even better results with this strategy.
First, based on our thorough analysis, we recommend adding the 60 and 40 levels to the Stochastic Oscillator. By doing this, you can filter out trades more effectively. Only execute trades when the Stochastic Oscillator is between these levels and the RSI crosses the 50 line. This additional filter enhances the accuracy of the signals and reduces the chances of false entries.
Second, always pay attention to support and resistance levels when exiting a trade. These levels are critical as they often serve as decision points where the price might reverse or consolidate. Integrating this into your strategy will help you maximize profits and minimize losses.
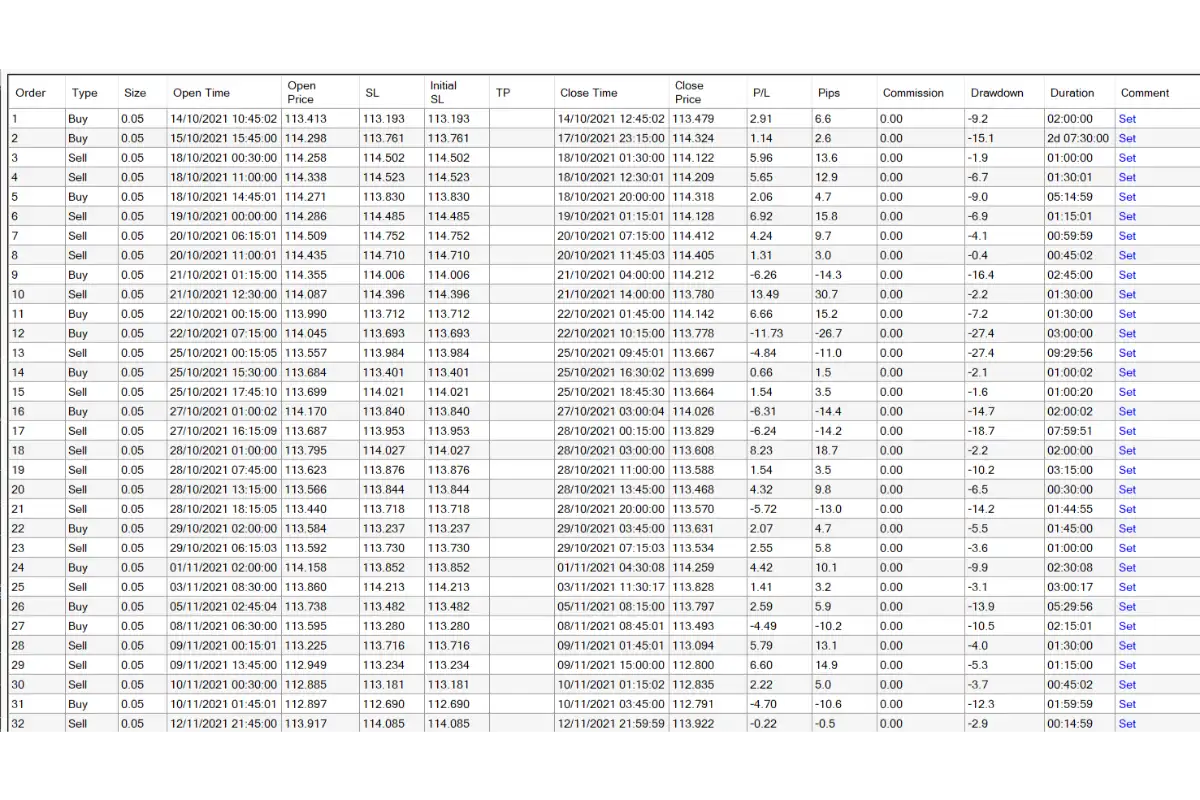
To illustrate the strategy’s effectiveness, our team conducted a backtest from December 13, 2021, to November 13, 2021, on the 15-minute time frame using the USD/JPY currency pair. The results were impressive: out of 32 trades, 23 were profitable, and only 9 resulted in losses. This equates to a success rate of approximately 72%, showcasing the strategy’s potential. The overall profitability of the strategy was around 44%, making it highly favorable for traders.

Lastly, we encourage you to test this strategy and share your results in the comments. However, it’s essential to note that our team at PicoChart does not endorse or reject any specific strategy. You should select and refine a strategy based on your experience and knowledge. Always test strategies in a demo account and perform multiple backtests before using them in live trading. Remember, you are solely responsible for your trading outcomes, whether profit or loss.
By following these tips and continuously refining your approach, you can leverage the RSI and Stochastic Scalping Strategy to its fullest potential. Stay disciplined, be patient, and let the strategy work for you. Happy trading!
Frequently Asked Questions:
1. What is the main advantage of using the RSI and Stochastic Oscillator for scalping?
The combination of these indicators provides precise entry and exit signals, enhancing trading accuracy and effectiveness.
2. What time frames are best for the RSI and Stochastic scalping strategy?
This strategy works best on lower time frames such as 1-minute, 5-minute, 15-minute, and 30-minute charts.
3. Do I need to adjust the default settings of the RSI and Stochastic indicators?
While default settings are effective, adding a 50 level to the RSI and 40/60 levels to the Stochastic can improve trade filtering.
4. How do I determine my take profit and stop loss levels?
Take profit can be set at a one-to-one risk-to-reward ratio or based on support and resistance levels, while stop loss can be set using candlestick patterns or Stochastic reversals.

